FET AT WEEKLY RESISTANCEFET reentry after some profits, continued with low volume at daily charts
and with bearish signs
entry 0.45
FETUST trade ideas

FET LOW VOLUME AFTER BREAKOUTFET broke 4h resistance but printing low volume at 1d resistance and we see some divergence
retest to resistance area in inevitable
DYOR

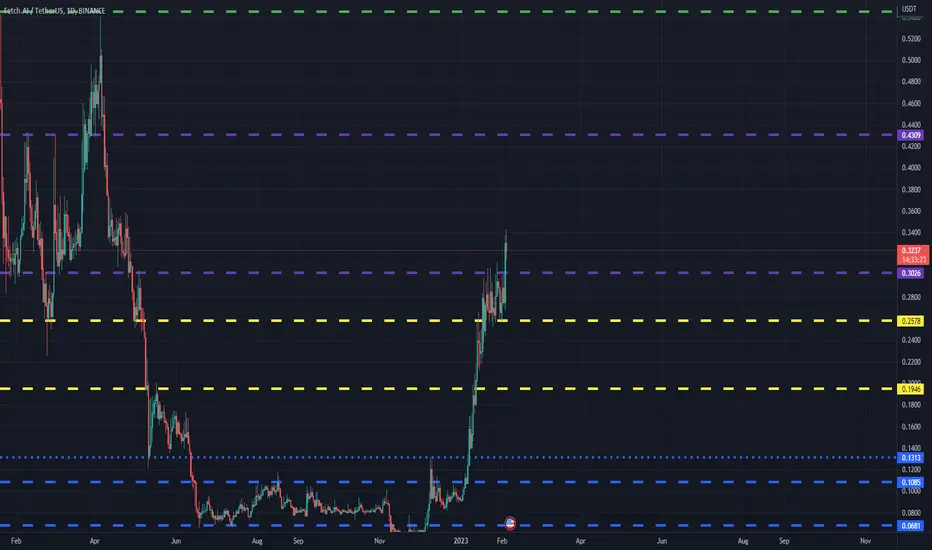
FETUSDT(Fetch.ai) Daily tf Range Updated till 4-02-23FETUSDT(Fetch.ai) Daily timeframe range. from local low it already retraced 530%+. thats actually some insane gains.retraced right back to its old range. it do have a decent retail interest. dont fotget AI is a new trend.
FET Fetch.ai Coin Price PredictionAs you can see on FET Fetch.ai Coin 4h Price chart price broke the key resistance level at around $0.30 and if price comes down to this level again there would be a nice buying opportunity.


SEND ITFET is about to explode and is ready for a huge move. AI narrative is already primed with AI projects being introduced to the mainstream. FET will be an easy way for the masses to capitalise. Watch this one pump 50% soon!

Nice targets! (bullish mid term)Here are main levels, studying main resistances for mid-term and checking also de Fib retracement. My personal target: 0.5 mid term. Let's see!

#FETLets don't forget fet and ocean. We will have accumulation process but conclusion will be super good. I will always share that analysis to you to remind you :)

#FETFet is not going to see those prices again :) In other bear season maybe. But I dont think so. Anyway, it has potential not only 5 dollars. Maybe 7 maybe 8 dollars. It has strong project and CZ is collecting FET and OCEAN. Just I will make hodl. This is my future. I love you FET :)

Sell FET buy back later for run.BTC will cause a market wide pull back. I will be stepping back in soon and have taken profits.

TOP ASSETS of the AI NARRATIVEThe release of ChatGPT into an open test version allowed everyone to use AI for their own purposes and needs. We were able to independently evaluate all of the benefits of AI. This trend has resulted in a surge in the number of projects in the crypto industry that use AI technologies. This idea is about the most effective and promising projects.
FETCH.ai
A product ecosystem in which the flagship products are:
CoLearn – joint creation and training of a neural network
Axim – combining and analyzing ML-based data
Atomix – providing stable liquidity and getting profit from the income generated by the protocol
Metrics of the $FET token:
Price: $0.27
ATH price:$0.9475
Market.cap: $220m
ATH market.cap: $708m
FDMC: $930m
Over the past 2 months, the $FET token has grown 4 times.
SingularityNET
A network of decentralized interconnected AI that can be combined to form a single AI that outperforms separate private components. Singularity NET is also a project incubator for AI-based projects in a variety of fields.
Metrics of the $AGIX token:
Price: $0.2
ATH price: $1.03
Market.cap: $235m
ATH market.cap:$452m
FDMC: $400m
Over the past 2 months, the $AGIX token has grown 2 times
Artificial Liquid Intelligence
A network that aims to create a metaverse called Noah's Ark in order to preserve humanity's culture, history, and collective intelligence. AlethiaAI developed iNFT technology for AI-powered NFT avatar creation, animation, and generation
Metrics of the $ALI token:
Price: $0.036
ATH price: $0.12
Market.cap:$58m
ATH market.cap:$86m
FDMC: $362m
Over the past 2 months, the $ALI has grown 3 times
Ocean
A data monetization protocol based on ERC-721 and ERC-20 data tokens. Any user can buy and sell datasets on the project's marketplace
Metrics of the $OCEAN token:
Price: $0.26
ATH price:$1.7
Market.cap: $164m:
ATH market.cap: $322m
FDMC: $378m
Over the past 2 months, the $OCEAN token has grown 2 times
ORAICHAIN
Layer 1 blockchain for AI-powered data economy and Oracles. Oraichain combines AI and blockchain for innovation and, as a result, should revolutionize both directions to make them compatible and integrable. Oraichain focuses on providing decentralized platforms for data and AI, standardizing methods to validate AI-based calculations on the chain, and ensuring AI correctness. In the field of blockchain, Oraichain focuses on the scalability and compatibility of its oracle solutions and services with other networks in order to expand the usefulness of the Oraichain ecosystem
Metrics of the $ORA token:
Price: $4.24
ATH price: $102
Market.cap: $8.7m
ATH market.cap: $77m
FDMC: $83.9m
Over the past 2 months, the $ORAI token has grown 4 times
BitTensor
Bittensor is an open source protocol that provides a decentralized blockchain-based machine learning network. Machine learning models are co-taught and rewarded in TAO based on the information value they provide to the team. TAO also provides external access, allowing users to extract information from the network and tailor its activities to their needs.
$TAO is not traded on DEX or CEX; the only way to purchase $TAO is through the OTC market and transfer tokens to the polkadot wallet. Since the beginning of trading in $TAO in July, the price of the token has increased nearly tenfold
Conclusion
The advancement of AI adoption and usage, as well as the benefits that it provides, ensures the growth of AI projects in addition to the positive market. We implement and use AI for our operational tasks as a company that wants to be successful in the market and gain advantages. Write in comments your thoughts about mentioned projects and ways of using AI for you! Thanks for reading

FET/USDT. BitVero Crypto Academy.
Disclamer:
We are not financial advisors. The content that we share on this website are for educational purposes and are our own personal opinions.


Fetch.ai (FET) - Bullish divergenceSome alt-token sell offs are ridiculous. Have no idea who is selling after a 90% correction. The secret is to buy low, sell high.
On the above 1-day chart price action has corrected 90% since last November. Now is a excellent moment to be long. Why?
1) The ‘incredible buy’ signal.
2) Regular bullish divergence. Multiple oscillators are printing positive divergence with price action.
3) RSI resistance breakout.
4) Price action tests past resistance (see weekly chart below).
Is it possible for price action to fall further? Sure.
Is it probable? No.
Ww
Type: trade
Risk: <=6% of portfolio
Timeframe: 1 to 3 months
Return: Don’t know.
Weekly chart - Price action testing past resistance
