FET buy IdeaFET is moving in a parallel channel also turned its long term resistance into support.
This could be the deciding point for FET to move up.
FETUST trade ideas

$FET Price AnalysisGreetings to the dear friends who are viewing this analysis. Thank you for taking the time to read my analysis, and I hope you will share your opinions about it.
This analysis is solely based on chart analysis and does not take into account any aspects of news, cryptocurrency fundamentals, or macroeconomics.
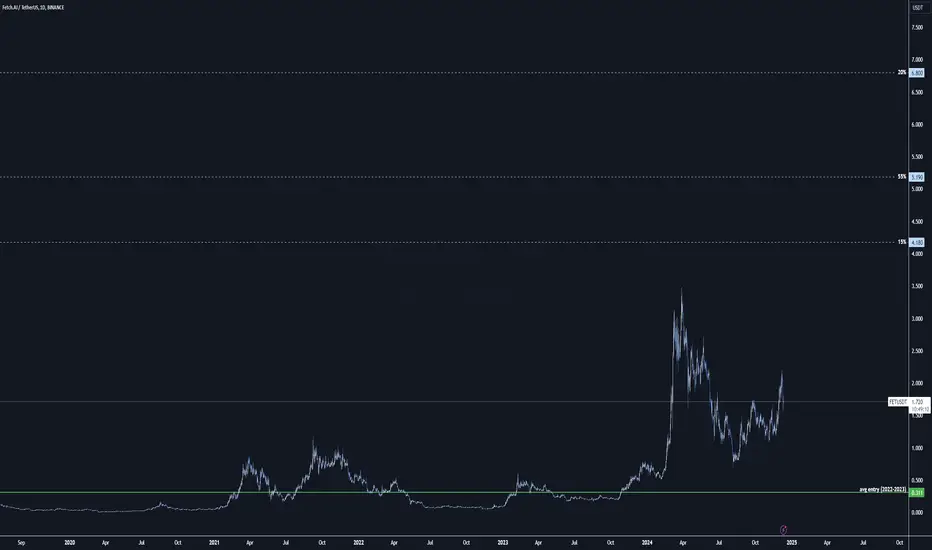
As a result, the future reality of the price may move completely contrary to what is presented and follow a different path. I believe this chart should first undergo a correction of about 17% and then it can experience a 100% growth. I have marked the suitable buying range in green, and I see the ideal buying price at around $1.3. I have also marked the ideal selling range in red, which is around $2.77. I hope that everyone's trades are consistently profitable.

FET LONG: Daily Bullish Orderflow. On all accounts, FET Bullish Orderflow:
1D BiSi (bullish fvg)
1D Mitigation Block [Orderblock alternative)
Optimal Trade Entry model (OTE) - 0.79 fib level.
Stop placement at $1.315, leveraging a wide stop. This is a compound position from previous long setup posted a couple of weeks ago


Long setupFet broke out of the ascending triangle, holding well the retest on the daily, price reacted to the equilibrium (imbalance) , position yourself, 5-7 box is the algorithm target.
NFA


$FET is the Sleeping Giant Awaiting a 5x!I've been fond of NYSE:FET , and this is one of the last chances to enter. Anything close to $1.55 is a great entry point.
Looking at the weekly and monthly charts, everything is aligned for higher prices. I've made two previous posts with different entry points, and I believe this is the last opportunity to enter before it moves up.
I plan to close this position if it closes below $1.27 on the weekly, which is just below the weekly mode. My goal is to hold this all the way to just under $10.
------------
December is for buying. So I think we will get a couple chances to add to it.

FET/USDT LONGFET/USDT
After a major CHoCH and then a major BOS, it has been able to fully confirm its long-term upward trend, making it a good entry point for this cryptocurrency.

FETUSDT 1WFET Update ~ 1W
#FET At Time Frame 1W, NYSE:FET Again rejected from this resistance line. The best way for now. You need to wait for this resistance line to be broken with a Full Candel. Or you can place buyers on this support block.
These two scenarios are with a minimum target of 20%+

FET tps for this bullbased on past bulls experience I believe fibs and cyclical highs and lows are the best levels to set for profit taking. yes, I do believe in decentralisation and crypto - its utility and potential but I will not bag hold, thinking ahead of time for the next bear/shopping market
taking also in consideration my spot avg entry and bag size, these are my tp levels and respective bag %s for $BINANCE:FETUSDT. leaving some as moonshot for higher targets. once i get sls/trailling stops I will update the chart, too soon to plan for those
do as you please with it 🤝
FETUSDT' Retracement Could Signal Big Moves AheadFETUSDT has demonstrated strong upward momentum, surpassing important resistance levels and establishing a clear uptrend. However, after peaking near $2.195, the price is now pulling back, providing traders an opportunity to reassess key price levels for future moves.
Currently, the price is nearing a significant support zone between $1.756 and $1.709. If buyers (bulls) manage to hold this support level, the upward trend may resume, potentially targeting the recent high of $2.195 or even higher.

FET Token Analysis: Charting the Course to Potential 5x GainsIn this video, we analyze the current price action of Fetch.ai's FET token, which is experiencing market indecision around the 38% Fibonacci retracement level. We'll discuss the importance of confirming this level as support and the potential for a bullish push toward the previous all-time high (ATH). If FET can break through and establish the ATH as a new support, we could see a trajectory toward a 5x return. However, considering the current market cap of approximately $5.36 billion, a 15x return appears less likely. Alternatively, we'll explore the scenario of a price movement toward $1.10, awaiting a retest for potential entry points, with the same profit targets in mind. Join us as we navigate these possibilities and outline strategic approaches for swing traders aiming to capitalize on FET's market dynamics.

#FETUSDT Analysis: Is a Big Move Brewing? Yello ,#FETUSDT has shown remarkable bullish momentum recently, breaking through key resistance levels and forming a clear upward trajectory. However, after reaching a high near $2.199, the price is retracing, signaling a potential opportunity to reevaluate key levels for the next move.
💎The price is currently approaching the critical support zone around $1.699–$1.744. This area coincides with the 100 EMA on the 4-hour chart, which adds confluence to its significance. If bulls successfully defend this zone, we could see a continuation of the upward move, with potential targets at $2.199and beyond. A breakout above this level would likely accelerate bullish momentum, pushing the price toward the psychological resistance of $2.697.
💎On the downside, the demand zone near $1.522-1.550 is the next key area to monitor if the current support fails. This zone has historically provided strong buying interest, and a bounce from here would offer another chance for bulls to regain control. However, if the price closes a daily candle below $1.550, it would invalidate the bullish structure and open the door for further downside, potentially toward $1.30 or lower.
💎Currently, the market is at a decisive point. Bulls must step in and hold above support to maintain the momentum, while bears are eyeing a deeper retracement to key demand levels.
Paradisers, remember that trading is a game of probabilities, not certainties. Stay disciplined, plan your entries carefully, and always manage your risk. The next move in #FETUSDT could be a game-changer for those who stay prepared and patient!
MyCryptoParadise
iFeel the success🌴

FETThe short-term target is set at $4, representing a potential upside of 96% from current levels. This presents a promising opportunity for significant returns in the near term, aligning with strategic trading objectives.


history doesn't repeat itself..When fetch reached 3,5$, I was arguing with a friend how low wave 4 would bring fetch.ai. I said that an 80% correction was not off the charts, cause that would mirror the last bullrun. My friend declared me for crazy. With all the hype around NVDA going on, this time had to different. And I liked to believe him, so we held on to our coins. Turns out this time is indeed nothing new, it's just an ordinary replica of the previous run. If you're scared here, I've good news. It aint over yet. Im looking to sell my bag this fall around 4$ per coin and buy this piece of garbage back at 20 cents. We just entered wave 5. Don't forget to sell, you're probably gonna regret it. NFA

FETUSDT | Lets Try To Snipe ItIn this setup, I've identified two key green zones as potential demand areas based on historical price action. These areas are where price wicks have previously formed, suggesting strong buying interest.
Why These Zones?
The green boxes highlight regions where buyers have aggressively entered the market in the past, creating significant wicks.
On lower timeframes (LTF), such areas are often liquidity zones, where institutional traders may step in to fill large orders.
Stop-Loss Placement
The stop-loss is set at 1.77, slightly below the second green box. This placement minimizes risk while accounting for potential liquidity grabs before a reversal.
Trading Plan:
Wait for the price to revisit the green zones.
Look for bullish confirmation signals (e.g., candlestick patterns, order flow shifts) before entering long positions.
Target key resistance levels for exits, ensuring a favorable risk-to-reward ratio.
Always trade with proper risk management and adjust stops if market structure changes. Let’s see how the price reacts! 🚀
I keep my charts clean and simple because I believe clarity leads to better decisions. Trading doesn’t have to be overly complicated, and I enjoy sharing setups that have worked well for me.
My approach is built on years of experience and a solid track record. I don’t claim to know it all, but I’m confident in my ability to spot high-probability setups. It’s all about learning and growing together as traders, and I’m here to share what I see.
The markets can confirm what the charts whisper if we’re paying attention. I hope these levels help you as much as they’ve helped me in the past. Let’s see how this plays out!
My Previous Hits
🐶 DOGEUSDT.P: Next Move
🎨 RENDERUSDT.P: Opportunity of the Month
💎 ETHUSDT.P: Where to Retrace
🟢 BNBUSDT.P: Potential Surge
📊 BTC Dominance: Reaction Zone
🌊 WAVESUSDT.P: Demand Zone Potential
🟣 UNIUSDT.P: Long-Term Trade
🔵 XRPUSDT.P: Entry Zones
🔗 LINKUSDT.P: Follow The River
📈 BTCUSDT.P: Two Key Demand Zones
🟩 POLUSDT: Bullish Momentum

The Risk-Reward Equation for FETUSDT: Are You Prepared? - Fet...◳◱ On the BINANCE:FETUSDT chart, the Bband Breakout pattern suggests a consolidation phase that could precede a trend continuation or reversal. Traders might observe resistance around 2.098 | 2.354 | 3.003 and support near 1.449 | 1.056 | 0.407. Entering trades at 2.083 could be strategic, aiming for the next resistance level.
◰◲ General Information :
▣ Name: Fetch.ai
▣ Rank: 41
▣ Exchanges: Binance, Kucoin, Huobipro, Gateio, Mexc, Hitbtc
▣ Category / Sector: Infrastructure - Artificial Intelligence
▣ Overview: Fetch.ai is building a decentralized machine learning platform based on a distributed ledger, that enables anyone to share or exchange data.
◰◲ Technical Metrics :
▣ Current Price: 2.083 ₮
▣ 24H Volume: 252,042,706.709 ₮
▣ 24H Change: 8.32%
▣ Weekly Change: 27.42%%
▣ Monthly Change: 49.97%%
▣ Quarterly Change: 92.60%%
◲◰ Pivot Points :
▣ Resistance Level: 2.098 | 2.354 | 3.003
▣ Support Level: 1.449 | 1.056 | 0.407
◱◳ Indicator Recommendations :
▣ Oscillators: NEUTRAL
▣ Moving Averages: STRONG_BUY
◰◲ Summary of Technical Indicators : STRONG_BUY
◲◰ Sharpe Ratios :
▣ Last 30 Days: 5.65
▣ Last 90 Days: 2.71
▣ Last Year: 1.56
▣ Last 3 Years: 0.90
◲◰ Volatility Analysis :
▣ Last 30 Days: 1.26
▣ Last 90 Days: 1.03
▣ Last Year: 1.30
▣ Last 3 Years: 1.25
◳◰ Market Sentiment :
▣ News Sentiment: N/A
▣ Twitter Sentiment: N/A
▣ Reddit Sentiment: N/A
▣ In-depth BINANCE:FETUSDT analysis available at TradingView TA Page
▣ Your thoughts matter! What do you think of this analysis? Share your insights in the comments below. Your like, follow, and support are greatly valued and help sustain high-quality content.
◲ Disclaimer : Disclaimer
The content provided is for informational purposes only and does not constitute financial, investment, or trading advice. Always conduct your own research and consult a qualified professional before making any financial decisions. Use of the information is solely at your own risk.
▣ Explore the Power of Charting with TradingView
Unlock a wide range of financial analysis tools, data, and features to elevate your trading experience. Take a tour and see the possibilities. If you decide to upgrade your plan, you can receive up to $30 back. Discover more here - affiliate link -

FET can fly again (8H)From where we placed the green arrow on the chart, it seems that FET has entered the bullish phase.
This phase looks like a diametric diamond.
We have identified two entry points for this position.
The targets are also marked on the image.
Closing a daily candle below the invalidation level will violate this analysis.
For risk management, please don't forget stop loss and capital management
When we reach the first target, save some profit and then change the stop to entry
Comment if you have any questions
Thank You

FET Breaks Out: Bullish Momentum Ahead!NYSE:FET has broken out of a symmetrical triangle pattern and is currently holding above the breakout level!
📈 Entry: Accumulate above $1.90
🎯 Targets:
Midterm: $3.50 (80% upside)
Long-term: $6.00 (200% upside)
🛡️ Stop-loss: $1.70
Available for both spot and futures trading. The breakout confirms bullish momentum, making this a strong candidate for a trend continuation play.
ABOUT NYSE:FET
Fetch.ai ( NYSE:FET ) powers decentralized machine learning on autonomous economic agents, optimizing the economy and creating new value networks.
🚨 DYOR, NFA.
#Crypto #Altcoins #FET

TradeCityPro | FETUSDT Progress Toward a New All-Time High👋 Welcome to the TradeCityPro channel!
Let's analyze one of the top AI-focused crypto projects, Fetch.AI (FET), and identify opportunities for both spot buying and futures trading.
🌍 Market Overview
Before diving into FETUSDT, it’s essential to check Bitcoin’s behavior. Bitcoin continues to range, a trend that might persist for a few more days.
However, with the dominance of altcoins on the rise, attention remains on them. Bitcoin’s eventual breach of $100K could temporarily restore its dominance.
🕒 Weekly Time Frame
FET is one of the most bullish altcoins, having risen without revisiting its 2023 lows, largely due to the AI hype.
After rebounding from the $0.056 support, it surged to $3.104, followed by a significant correction to $0.745. This zone was an ideal Potential Reversal Zone (PRZ) as it aligned with the trendline and Fibonacci levels.
FET has bounced off the 0.382 Fibonacci level, and breaking above $3.104 could lead to targets of $4.868, $7.849, and $13.828 (calculated using Fibonacci extension).
Last week’s candle closed above the $1.613 resistance, signaling bullish momentum. You could consider buying with a stop loss at $1.094. For those holding from lower levels, it might be wise to secure initial capital and some profits.
As long as FET remains above its trendline, the outlook remains bullish.
📊 Daily Time Frame
FET is entering a significant resistance box between $1.99 and $2.54—potentially the final stronghold for sellers.
After breaking this zone, the path becomes clearer for higher targets, but expect temporary resistance or price fluctuations within this range. A breakout above $2.637 could provide another buying opportunity.
🕒 4-Hour Time Frame
FET is currently breaking out of the $1.957 resistance, aiming for the $2.637 target.
📈 Long Position Trigger
place a stop-buy above the current candle and set a secure stop loss around $1.739 to avoid being stopped out during minor pullbacks. This ensures you stay positioned for the longer-term uptrend.
📉 Short Position Trigger
avoid trading against the trend in a bull market. Focus on resting and preparing for the next upward wave.
💡 BTC Pair Insight
Against Bitcoin, FET has also shown strength, avoiding drops below the 0.00001390 support.
After breaking 0.00002574, this pair could witness significant bullish moves, making it a good time to hold onto FET.
🛠️ Summary & Strategy
Spot Buyers: Watch for pullbacks within the resistance box and aim for targets using Fibonacci extensions.
Futures Traders: Prioritize long positions aligned with the bullish trend and avoid counter-trend shorts.
📝 Final Thoughts
Stay calm, trade wisely, and let's capture the market's best opportunities!
This analysis reflects our opinions and is not financial advice.
Share your thoughts in the comments, and don’t forget to share this analysis with your friends! ❤️

#FET bullish structure bullish trend, cautious bearish📊#FET bullish structure bullish trend, cautious bearish ⚠️
🧠From a structural perspective, there are bullish structures of different cycles. The 4h-level bullish structure target has been achieved, so a period of decline is reasonable. Our first goal is to reduce holdings by 50% after completion here. The remaining positions can look forward to the target area of the daily and weekly bullish structures
Let's see👀
🤜If you like my analysis, please like💖 and share💬 BITGET:FETUSDT
