FHE/USDT Analysis – High Probability of a Bullish Trend
This futures pair is showing strong signs of entering a full-fledged bullish trend.
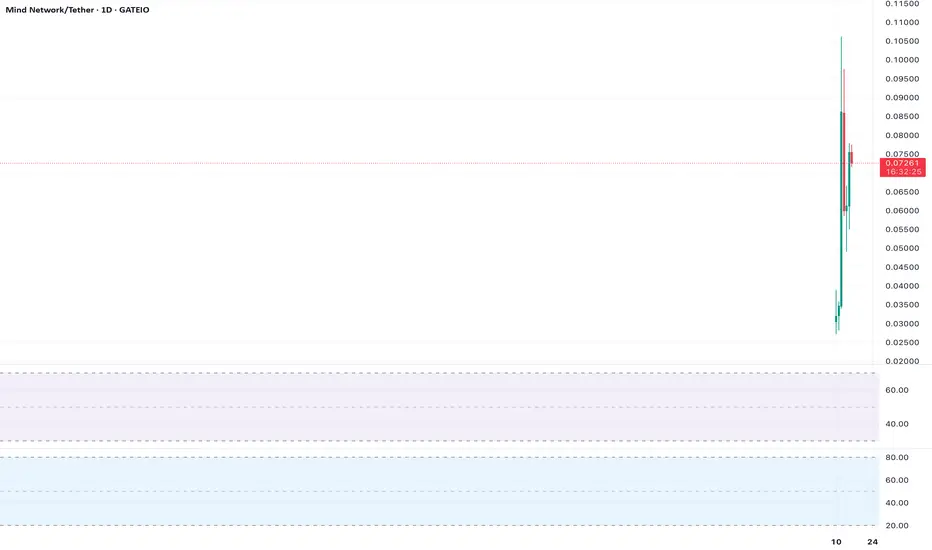
We are currently attempting to break through the key level of $0.078.
Below that, a strong volume zone has formed at $0.0756–$0.072, which is now acting as support.
We're looking at a potential long position up

FHE PERPETUAL TRADE Sold at $0.088FHE PERPETUAL TRADE
FHEUSDT SELL SETUP
Currently $0.087
Sold at $0.088
(Trading plan If FHE/USDT up to $0.10 we will add more shorts)
Expecting target $0.08 OR DOWN
Incase of early exist will update this anaylsis
Its not a Financial advice

Fibonacci Retracement Points to $0.0000010 TargetAnalysis:
ASX:FHE ’s 1-day chart shows the price at $0.00000079, near the 61.8% Fibonacci retracement level from a prior swing high ($0.0000015) to low ($0.00000050). A bounce from this level could target the 38.2% retracement at $0.0000010. RSI is neutral at 42.
Actionable Insight:
Long at $0.0000

Ichimoku Cloud Resistance Looms at $0.00000090Analysis:
On the 4-hour chart, ASX:FHE is approaching the Ichimoku Cloud’s lower edge at $0.00000090. The price is at $0.00000079, with the Tenkan-sen crossing above the Kijun-sen, signaling short-term bullishness. A cloud breakout could target $0.0000012, but low liquidity adds risk.
Actionable I

Double Bottom at $0.00000075 Signals ReversalAnalysis:
ASX:FHE ’s daily chart shows a potential double bottom at $0.00000075, a bullish pattern. The price is at $0.00000079, with RSI rising from oversold levels (30). A move above $0.00000085 confirms the pattern, targeting $0.0000011. Low volume is a risk.
Actionable Insight:
Long on a break
Volume Spike Could Ignite BreakoutAnalysis:
ASX:FHE ’s 1-hour chart shows a minor volume spike at $0.00000079, hinting at accumulation. The price is near the 50-period SMA ($0.00000080). A close above with sustained volume could target $0.00000095. Failure to break risks a drop to $0.00000075.
Actionable Insight:
Long on a close ab

Bearish Trendline Resistance at $0.00000085Analysis:
ASX:FHE faces a descending trendline resistance at $0.00000085 on the 4-hour chart. The price is consolidating below this level, with RSI at 45, showing no strong momentum. A rejection could push prices back to $0.00000070, while a breakout targets $0.0000010.
Actionable Insight:
Short o

Stochastic Oversold, Scalping OpportunityAnalysis:
On the 15-minute chart, ASX:FHE ’s Stochastic oscillator is oversold below 20, indicating potential for a quick bounce from $0.00000079. The price is near the lower Bollinger Band, reinforcing the setup. A move to the middle band ($0.00000083) is plausible. Low liquidity warrants tight st

Testing 200-EMA Support, Reversal or Breakdown?ASX:FHE is testing the 200-day EMA at $0.00000078 on the daily chart, a level that has acted as support in past consolidations. RSI is neutral at 40, offering no clear overbought/oversold signal. A bounce could push prices to $0.0000010, while a break below risks $0.00000060. Low volume suggests in

Bullish MACD Crossover Signals Short-Term BounceASX:FHE ’s 1-hour chart shows a bullish MACD crossover, with the MACD line crossing above the signal line at $0.00000079. This suggests short-term bullish momentum, supported by a slight uptick in trading volume. The price is approaching the 20-period EMA ($0.00000082), a key dynamic resistance. A b

See all ideas