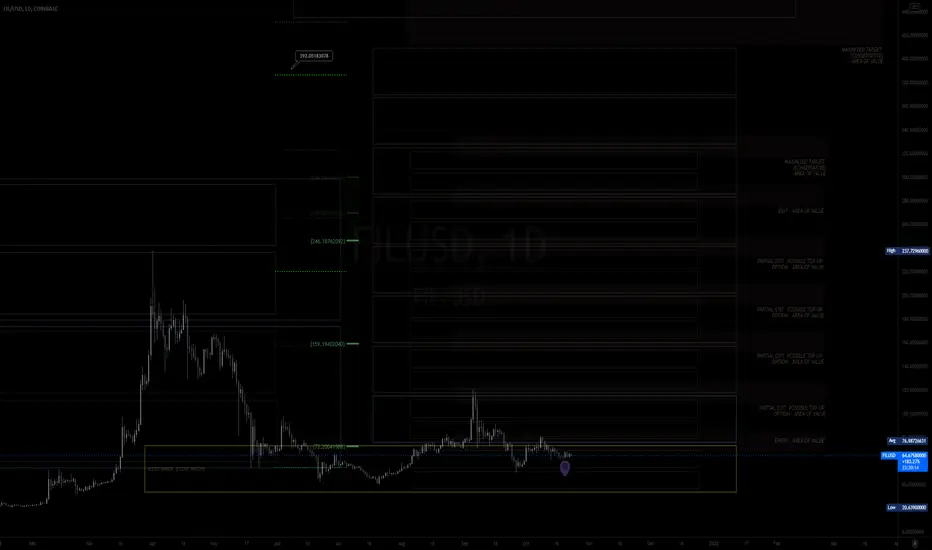
MY NOT SO MINIMALIST ANALYSIS (Version 2) FOR FILECOIN $FIL
10.24.21
0829H +8 SINGAPORE
ALERT: MARKED ENTRIES and EXITS FOR A SWING TRADE
LOWERED CLUSTERED TARGETS
HOW TO USE MY CHART
It is designed for SWING TRADES at the BOTTOM. I do not SHORT (in support of all the DUMB-MONEY traders like me.) Though you can still use it.
Created on a WEEKLY & DAILY Analysis of Dynamics of the Market.
LARGE BOXES are major pivots that will occur, while the small boxes are MINOR PIVOTS. These can be entries to a BUY/ SELL POSITION or an EXIT/PARTIAL EXIT/TOP-UP AREAS.
Watch out for Chart Patterns, Candlestick Math, Market Dynamics, and your Fibs.
This CHART is best used without indicators. The MINOR and MAJOR BOXES (TOPs and BOTTOMs), together with
the market's price action and the above mentioned is sufficient enough as analysis when ENTERING AND EXITING TRADES.
Thank You for your appreciation and support (Follows, Comments, and Likes.)
DISCLAIMER:
The findings of the following analysis are the sole opinions of the publisher of this idea and should not be taken as investment advice.
FILUSD.P trade ideas
Filecoin bias bullish after it break the descending trendlineExcellent risk and reward ratio with this pair after it break the descending trendline indicating bullish momentum.


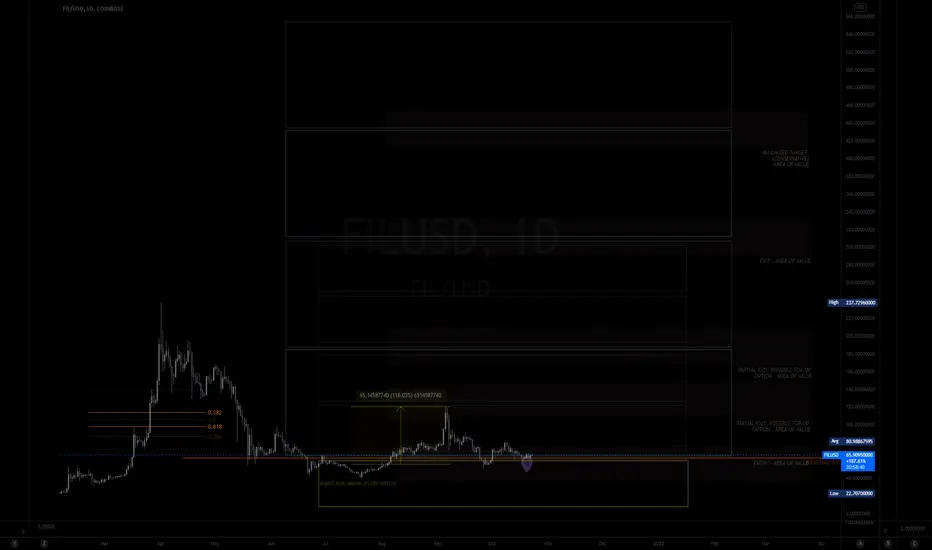
MY MINIMALIST ANALYSIS FOR FILECOIN $FIL
10.23.21
0739H +8 SINGAPORE
ALERT: MARKED ENTRIES and EXITS FOR A SWING TRADE
HOW TO USE MY CHART
It is designed for SWING TRADES at the BOTTOM. I do not SHORT (in support of all the DUMB-MONEY traders like me.) Though you can still use it.
Created on a WEEKLY & DAILY Analysis of Dynamics of the Market.
LARGE BOXES are major pivots that will occur, while the small boxes are MINOR PIVOTS. These can be entries to a BUY/ SELL POSITION or an EXIT/PARTIAL EXIT/TOP-UP AREAS.
Watch out for Chart Patterns, Candlestick Math, Market Dynamics, and your Fibs.
This CHART is best used without indicators. The MINOR and MAJOR BOXES (TOPs and BOTTOMs), together with
the market's price action and the above mentioned is sufficient enough as analysis when ENTERING AND EXITING TRADES.
Thank You for your appreciation and support (Follows, Comments, and Likes.)
DISCLAIMER:
The findings of the following analysis are the sole opinions of the publisher of this idea and should not be taken as investment advice.
FILUSD - Daily AnalysisToday we take a look at FILUSD. Feel free to leave a comment and like the video.
Cheers.

FIL- Time to pay attention!Before reading, get rid of your moonboy mentality and no emotions for dips/corrections! Cannot rule bearish scenarios! Dips are for buying!!
People are so focused on the hourly/daily timeframe that they get emotional on every dip! Take a step back to the weekly/monthly timeframe and see why I'm so bullish now. Stop looking at the short term dips/rise. Short term is irrelevant for the move that is coming!
You can't be emotional in these markets (stocks, forex, crypto, real estate, etc.). You will lose this game following the news and doing what the majority does. News creates emotions. Everything you need to know are on the charts. News are manipulated by the elites, and they take advantage of our emotions. Stop listening the news and pay more attention to the charts. Don't follow the majority, because the majority will lose in the end! Also, don't buy the hype when everyone is buying.. instead buy the fear when everyone else is selling
Everything is on the chart! Cryptocurrencies are on the verge of exploding higher. Dips/Corrections are normal and needed in a bull market, and are buying opportunities! Huge gains opportunity in the coming months! Never trade blindly. Use multiple indicators to make calculated decisions. Trade with no emotions!
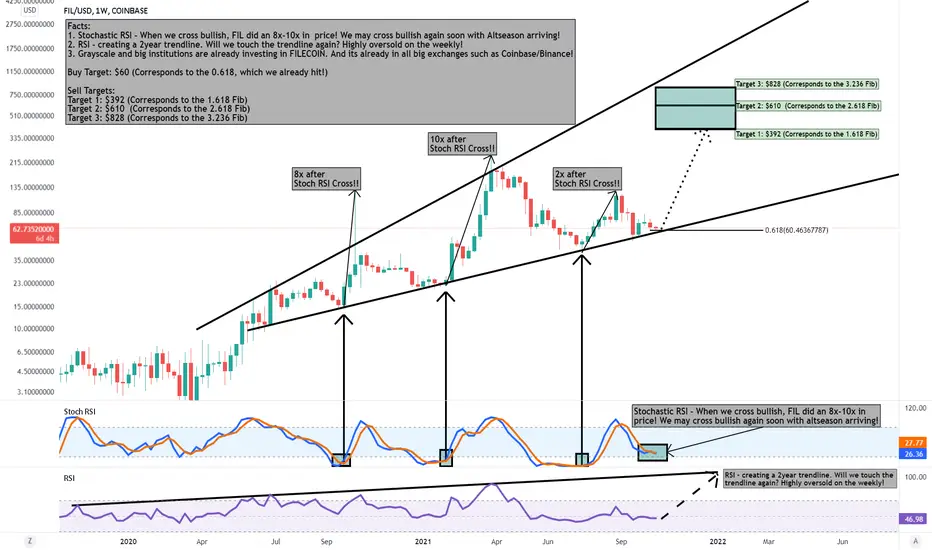
Facts:
1. Stochastic RSI - When we cross bullish, FIL did an 8x-10x in price! We may cross bullish again soon with Altseason arriving!
2. RSI - creating a 2year trendline. Will we touch the trendline again? Highly oversold on the weekly!
3. Grayscale and big institutions are already investing in FILECOIN. And its already in all big exchanges such as Coinbase/Binance!
Buy Target: $60 (Corresponds to the 0.618, which we already hit!)
Sell Targets:
Target 1: $392 (Corresponds to the 1.618 Fib)
Target 2: $610 (Corresponds to the 2.618 Fib)
Target 3: $828 (Corresponds to the 3.236 Fib)
"If you can't beat the fear, do it scared!"
"Be fearful when others are greedy, and greedy when others are fearful!" - Warren Buffet.
"Markets are a device for transferring money from the impatient to the patient. - Warren Buffet
"Show me the charts, and I'll tell you the news." - Bernard Baruch
"The secret to investing/trading is figuring out how rich you want to be and how poor you're willing to become."
"If you want to live like the 5% of the population who are hugely successful, then don't act like the 95%!"
FILUSD-4H- Ready to catch the wave 3We are finishing correction on wave 2 (red).
If am right this is the start of wave 3.
Target is 1.61 extension of wave 1
Risk/Reward ratio 1 to 10
Win big, loose small
Best Regards

Filecoins previous 2H chart run enlarged and compared to presentTook filecoin's previous massive spike, consolidation, accumulation period, blew it up and pasted it over our weekly chart to compare with where we are currently. If we repeated the same pattern on a larger scale, filecoin could go into a very long period of accumulation before it begins to run again.


Looking back in history for FILThe filecoin Github repository recently had some updates on the their rosetta integration, the reason why we are covering this is so we can model the EWT price movement after their coinbase listing. Looking back in history, filecoin was listed on December 2020 and price was trading between $20 - $30 back then. When bitcoin was done running in Jan 2021, we saw filecoin gained almost 10x. Could we see the same for EWT?

Inverted Head and Shoulders pattern 30% gainsI entered this trade at 75 usd price and the target is arround 97 usd. I will scale selling betwin 90 to 95 usd. Worth to get the trade entering on a pull back
Tips: 0xCe4DEa3E589A15672a5FefEf7D4d9d502d1803Ba

FIL/USDsomething 2 look @............................................................................................................................................................................................................................................................................................................

Filecoin (FIL) - October 5Hello?
Welcome, traders.
By "following", you can always get new information quickly.
Please also click "Like".
Have a nice day.
-------------------------------------
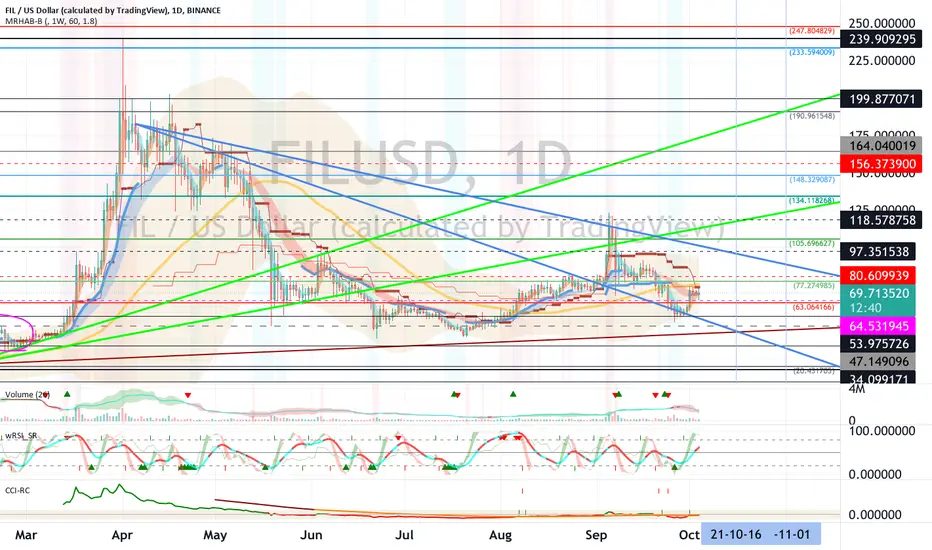
(FILUSD 1W Chart) - Mid-Long-Term Perspective
Above the 47.149096-53.975726 section: The uptrend is expected to continue.
(1D chart)
Support section: 63.064166-77.274985 section.
First resistance zone: near point 105.696627 (97.351538-118.578758)
Second resistance section: 134.118268-148.329087 section.
If it falls from the support zone, it may move towards the 47.149096 point, so trade cautiously.
If it falls from the 47.149096 point, it is highly likely to enter the mid- to long-term investment area, so you need to think about countermeasures.
If the price is maintained by moving up to the 77.274985-105.696627 section, it is expected to turn into an uptrend.
We do not recommend buying when the price is rising as the downward correction to break out of the downtrend line may continue.
-------------------------------------
(FILBTC 1W Chart) - Mid-Long-Term Perspective
Above the 0.000796-0.000969 section: The uptrend is expected to continue.
Above 0.001398 point: Expected to create a new wave.
(1D chart)
Support interval: 0.001211-0.001437 interval.
First resistance interval: near 0.001890 point (0.001890-0.001981)
Second resistance section: 0.002343-0.002569 section
If it falls from the support zone, it may enter the mid- to long-term investment area, so careful trading is required.
However, you can touch the 0.000796-0.000969 section and rise, so you need to think about countermeasures.
If the price holds in the range of 0.001437-0.001890, it is expected to turn into an uptrend.
------------------------------------------
We recommend that you trade with your average unit price.
This is because, if the price is below your average unit price, whether it is in an uptrend or in a downtrend, there is a high possibility that you will not be able to get a big profit due to the psychological burden.
The center of all trading starts with the average unit price at which you start trading.
If you ignore this, you may be trading in the wrong direction.
Therefore, it is important to find a way to lower the average unit price and adjust the proportion of the investment, ultimately allowing the funds corresponding to the profits to regenerate themselves.
------------------------------------------------------------ -----------------------------------------------------
** All indicators are lagging indicators.
Therefore, it is important to be aware that the indicator moves accordingly with the movement of price and volume.
However, for the sake of convenience, we are talking in reverse for the interpretation of the indicator.
** The MRHAB-O and MRHAB-B indicators used in the chart are indicators of our channel that have not been released yet.
(Because it is not public, you can use this chart without any restrictions by sharing this chart and copying and pasting the indicators.)
** The wRSI_SR indicator is an indicator created by adding settings and options to the existing Stochastic RSI indicator.
Therefore, the interpretation is the same as the traditional Stochastic RSI indicator. (K, D line -> R, S line)
** The OBV indicator was re-created by applying a formula to the DepthHouse Trading indicator, an indicator disclosed by oh92. (Thanks for this.)
** Support or resistance is based on the closing price of the 1D chart.
** All descriptions are for reference only and do not guarantee a profit or loss in investment.
(Short-term Stop Loss can be said to be a point where profit and loss can be preserved or additional entry can be made through split trading. It is a short-term investment perspective.)
FIL to $13?If bitcoin rejects retest in a few days and plummets to 10k, shorting FIL may be a good move

FIL getting ready for a Rally?On a Daily chart, FIL appears to be channeling down (semi-channeling) towards a historic Support all the way from the year 2020. I'm not counting on FIL to reach the Support, I'm more interested with what happens to RSI and MACD. Historically, whenever FIL's RSI dipped below 30 on a Daily chart, the price recovered at least 50% rather quickly. This can be observed on May 19th 2021, June 21st to 29th 2021, and a few other times. This recovery pattern is more evident on lower timeframes, have a look at those dates on 1H or 4h.
In the mean time, I am playing the down trending channel, hoping for a rally by observing 2 main indicators on a Daily chart.
#1 RSI reaching 30 or lower and then breaking the trendline
#2 MACD Cross Up

FilecoinWe got that zig-zag 5-3-5 correction on its way baby. Lets get it done and lets go! Red carpet is the target before continuing up!

Filecoin (FIL) - September 8Hello?
Welcome, traders.
By "following", you can always get new information quickly.
Please also click "Like".
Have a nice day.
-------------------------------------
(FILUSD 1W Chart)
There's not much to tell from this chart.
However, if the price is maintained above the 47.149096-53.975726 range, it is expected that the upward trend will continue.
(1D chart)
If the price is maintained in the range of 77.274985-105.696627, the uptrend is expected to continue.
If you fall from the 63.064166-77.274985 section, you can touch near the 47.149096 point, so you need to trade carefully.
A significant resistance interval is the 156.373900-167.010019 interval.
-------------------------------------
(FILBTC 1W chart)
If the price holds above the 0.001544 point, it is expected that the uptrend will continue.
(1D chart)
If the price is maintained in the range of 0.001437-0.001890, it is expected to turn into an uptrend and rise.
If it declines from the 0.001211-0.001437 point, it is likely to enter the mid- to long-term investment zone, so you need to trade cautiously.
However, you can touch the 0.000796-0.000969 section and rise, so you must also think about how to respond.
If it moves towards the 0.002343-0.002569 interval, I expect it to re-determine the trend.
------------------------------------------
We recommend that you trade with your average unit price.
This is because, if the price is below your average unit price, whether it is in an uptrend or in a downtrend, there is a high possibility that you will not be able to get a big profit due to the psychological burden.
The center of all trading starts with the average unit price at which you start trading.
If you ignore this, you may be trading in the wrong direction.
Therefore, it is important to find a way to lower the average unit price and adjust the proportion of the investment, ultimately allowing the funds corresponding to the profits to regenerate themselves.
------------------------------------------------------------ -----------------------------------------------------
** All indicators are lagging indicators.
Therefore, it is important to be aware that the indicator moves accordingly with the movement of price and volume.
However, for the sake of convenience, we are talking in reverse for the interpretation of the indicator.
** The wRSI_SR indicator is an indicator created by adding settings and options to the existing Stochastic RSI indicator.
Therefore, the interpretation is the same as the traditional Stochastic RSI indicator. (K, D line -> R, S line)
** The OBV indicator was re-created by applying the formula to the DepthHouse Trading indicator, an indicator disclosed by oh92. (Thanks for this.)
** See support, resistance, and abbreviation points.
** Support or resistance is based on the closing price of the 1D chart.
** All descriptions are for reference only and do not guarantee a profit or loss in investment.
Explanation of abbreviations displayed in the chart
R: A point or section of resistance that requires a response to preserve profits.
S-L: Stop Loss point or section
S: A point or section where you can buy to make a profit as a support point or section.
(Short-term Stop Loss can be said to be a point where profit and loss can be preserved or additional entry can be made through split trading. It is a short-term investment perspective.)
GAP refers to the difference in prices that occurred when the stock market, CME, and BAKKT exchanges were closed because they are not traded 24 hours a day.
G1 : Closing price when closed
G2: Opening price
(Example) Gap (G1-G2)

fil or flash ?!!):No description, everything is clear on the chart, it looks like the fil has started with all the power of a rally.

FIL OutlookI missed a huge run a few months ago and have learned from my mistakes. Long term down pressure seemingly snapped, expecting some more selling pressure before the bullish buying takes over breaking into a large cup & handle that should bring us back to ATH in fall/winter 2021. COINBASE:FILUSD

FILUSD - 1D - Watching this oneHi guys,
I'm currently watching for this boy.
Expecting a nice move in the coming days / week.
Bollinger bands tightening on the daily
Bullish div on RSI
I expect a move to the upside but a downside move could be also possible if BTC makes a strong retrace.
In this case i would add more in the red zone.
Wait and see
Like if you share this idea
NFA

FILUSD 4H Can it break-out downtrend ??In FILUSD 4H
We should wait price break-out the downtrend line and confirm 2 important parts at close
1.Confirm the close is higher than downtrend line .
2.Confirm the type of candlestick
the upper shadow must shorter than 1/2 body
After that we can setup stop loss
at red line (70.41)
1st target is 1(82.53)
2nd target is 1.272~1.382(90.63~93.91)
3rd target is 1.618(100.94)

Filecoin (FIL) - Resistance BreakoutFilecoin (FIL) - Resistance Breakout
Target: $127
...................

