Filecoin (FIL) - September 8Hello?
Welcome, traders.
By "following", you can always get new information quickly.
Please also click "Like".
Have a nice day.
-------------------------------------
(FILUSD 1W Chart)
There's not much to tell from this chart.
However, if the price is maintained above the 47.149096-53.975726 range, it is expected that the upward trend will continue.
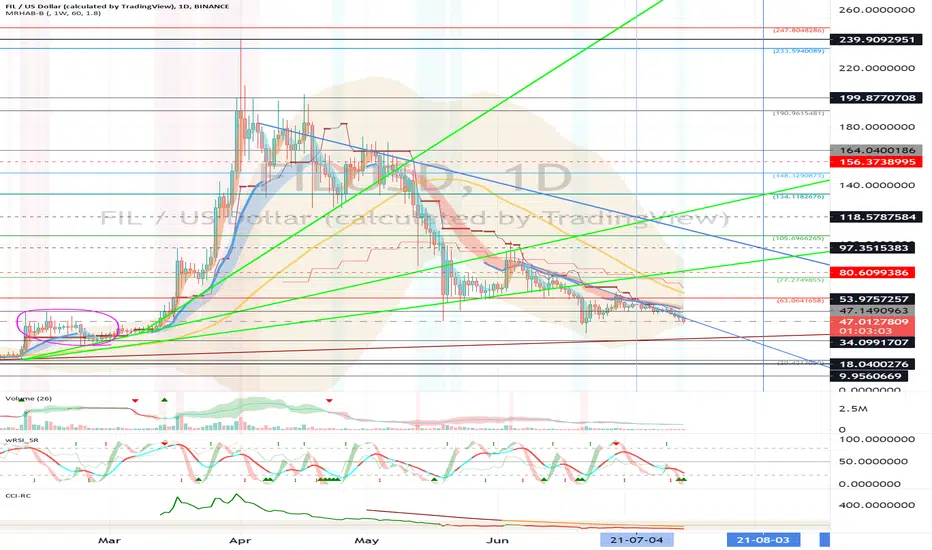
(1D chart)
If the price is maintained in the range of 77.274985-105.696627, the uptrend is expected to continue.
If you fall from the 63.064166-77.274985 section, you can touch near the 47.149096 point, so you need to trade carefully.
A significant resistance interval is the 156.373900-167.010019 interval.
-------------------------------------
(FILBTC 1W chart)
If the price holds above the 0.001544 point, it is expected that the uptrend will continue.
(1D chart)
If the price is maintained in the range of 0.001437-0.001890, it is expected to turn into an uptrend and rise.
If it declines from the 0.001211-0.001437 point, it is likely to enter the mid- to long-term investment zone, so you need to trade cautiously.
However, you can touch the 0.000796-0.000969 section and rise, so you must also think about how to respond.
If it moves towards the 0.002343-0.002569 interval, I expect it to re-determine the trend.
------------------------------------------
We recommend that you trade with your average unit price.
This is because, if the price is below your average unit price, whether it is in an uptrend or in a downtrend, there is a high possibility that you will not be able to get a big profit due to the psychological burden.
The center of all trading starts with the average unit price at which you start trading.
If you ignore this, you may be trading in the wrong direction.
Therefore, it is important to find a way to lower the average unit price and adjust the proportion of the investment, ultimately allowing the funds corresponding to the profits to regenerate themselves.
------------------------------------------------------------ -----------------------------------------------------
** All indicators are lagging indicators.
Therefore, it is important to be aware that the indicator moves accordingly with the movement of price and volume.
However, for the sake of convenience, we are talking in reverse for the interpretation of the indicator.
** The wRSI_SR indicator is an indicator created by adding settings and options to the existing Stochastic RSI indicator.
Therefore, the interpretation is the same as the traditional Stochastic RSI indicator. (K, D line -> R, S line)
** The OBV indicator was re-created by applying the formula to the DepthHouse Trading indicator, an indicator disclosed by oh92. (Thanks for this.)
** See support, resistance, and abbreviation points.
** Support or resistance is based on the closing price of the 1D chart.
** All descriptions are for reference only and do not guarantee a profit or loss in investment.
Explanation of abbreviations displayed in the chart
R: A point or section of resistance that requires a response to preserve profits.
S-L: Stop Loss point or section
S: A point or section where you can buy to make a profit as a support point or section.
(Short-term Stop Loss can be said to be a point where profit and loss can be preserved or additional entry can be made through split trading. It is a short-term investment perspective.)
GAP refers to the difference in prices that occurred when the stock market, CME, and BAKKT exchanges were closed because they are not traded 24 hours a day.
G1 : Closing price when closed
G2: Opening price
(Example) Gap (G1-G2)
FILUSD.P trade ideas

fil or flash ?!!):No description, everything is clear on the chart, it looks like the fil has started with all the power of a rally.

FIL OutlookI missed a huge run a few months ago and have learned from my mistakes. Long term down pressure seemingly snapped, expecting some more selling pressure before the bullish buying takes over breaking into a large cup & handle that should bring us back to ATH in fall/winter 2021. COINBASE:FILUSD

FILUSD - 1D - Watching this oneHi guys,
I'm currently watching for this boy.
Expecting a nice move in the coming days / week.
Bollinger bands tightening on the daily
Bullish div on RSI
I expect a move to the upside but a downside move could be also possible if BTC makes a strong retrace.
In this case i would add more in the red zone.
Wait and see
Like if you share this idea
NFA

FILUSD 4H Can it break-out downtrend ??In FILUSD 4H
We should wait price break-out the downtrend line and confirm 2 important parts at close
1.Confirm the close is higher than downtrend line .
2.Confirm the type of candlestick
the upper shadow must shorter than 1/2 body
After that we can setup stop loss
at red line (70.41)
1st target is 1(82.53)
2nd target is 1.272~1.382(90.63~93.91)
3rd target is 1.618(100.94)

Filecoin (FIL) - Resistance BreakoutFilecoin (FIL) - Resistance Breakout
Target: $127
...................


Bottoms up FILUSD those cups!!!!Hello Trading View Community,
FILUSD seems to have found a nice round bottom and curled back up to the 0.236 Fib level. This level acted as nice support during the March rally that pushed FILUSD to $238. However, once support this fib level is now FILUSD primary resistance zone. Shifting our focus to the EMAs, we can see FILUSD consolidating below 0.236 fib and above 100 EMA (orange line) and 200 EMA (red line). Also notice the 20 EMA (solid blue) and 50 EMA (yellow line) trying to cross up on 200EMA, whenever the 50 EMA crosses up on the 200 EMA this is considered by many traders as a Golden Cross.
If FILUSD is able to break above and reclaim 0.236 level as support, the next leg up would be mid $90s range which has acted as resistance many times before.
Thank you guys for checking out this idea on FILUSD. If you find this analysis useful, support with a simple "Like" or "Follow".
Trade carefully and remember these are just ideas, not trading advise.

Filecoin Advance Continuation pt. 2FIL/USD Continuation
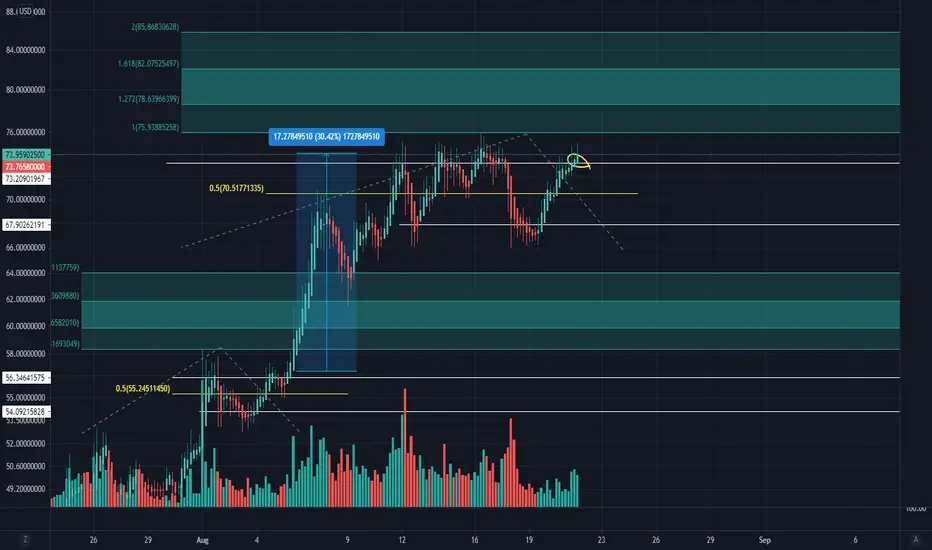
Accumulated Gains Since Preliminary Entry (56.81): 30.42%
Prognosis: On 8/17 FIL corrected 10% to TR-S, then shot back up the range, bypassing TR-M to TR-R (73.71) where it now sits poised to hammer the target zones again. Look for a possible retrace to TR-M, reconsolidation at TR-R or 1.0 Fib level.
Summary: Had you entered this trade with me at its preliminary and only took profit but not exited, you would've netted a 30.42% return in 16 days. Nice little run.
*Do you like big wins and big money? Do you have strong hands and patience?
I'm a full-time Wyckoff VSA crypto swing trader (since 2017) and I regularly seek out the most lucrative swings available on all the major exchanges.
All my charts are clean, straightforward, and easy to follow. No junk, no needless indicators, just solid volume spread analysis ( VSA ) and 'take-the-money-and-run' Fibonacci target zones.
My win rates are between 80-85%. Follow me on TradingView and see for yourself.
I review over 300 coins & tokens daily and handpick all the runners myself (no bot signals).
** Not financial advice. Please trade at your own risk.

Filecoin (FIL) - August 7Hello?
Welcome, traders.
By "following", you can always get new information quickly.
Please also click "Like".
Have a nice day.
-------------------------------------
(FILUSD 1W Chart)
If the price holds above the 47.1490963-53.9757257 range, we expect the uptrend to continue.
(1D chart)
It remains to be seen if the 63.0641658-77.2749855 section can find support and move up.
If the price holds above the 77.2749855 point, it is expected to turn into an uptrend and move higher.
If it falls in the 47.1490963-53.9757257 section, it is likely to deepen into the mid- to long-term investment area, so careful trading is required.
-------------------------------------
(FILBTC 1W chart)
If the price holds above the 0.0015437 point, it is expected that the uptrend will continue.
(1D chart)
If the price holds in the range of 0.0014371-0.0018899, it is expected to turn into an uptrend.
However, it is expected that the uptrend will continue only when it deviates from the downtrend line.
If it goes down, you should check to see if it finds support in the 0.0012107-0.0014371 zone.
If it falls from the 0.0012107 point, it is possible to enter the mid- to long-term investment area, so you need to trade cautiously.
------------------------------------------
We recommend that you trade with your average unit price.
This is because, if the price is below your average unit price, whether it is in an uptrend or in a downtrend, there is a high possibility that you will not be able to get a big profit due to the psychological burden.
The center of all trading starts with the average unit price at which you start trading.
If you ignore this, you may be trading in the wrong direction.
Therefore, it is important to find a way to lower the average unit price and adjust the proportion of the investment, ultimately allowing the funds corresponding to the profits to regenerate themselves.
------------------------------------------------------------ -----------------------------------------------------
** All indicators are lagging indicators.
Therefore, it is important to be aware that the indicator moves accordingly as price and volume move.
However, for the sake of convenience, we are talking in reverse for the interpretation of the indicator.
** The wRSI_SR indicator is an indicator created by adding settings and options to the existing Stochastic RSI indicator.
Therefore, the interpretation is the same as the traditional Stochastic RSI indicator. (K, D line -> R, S line)
** The OBV indicator was re-created by applying a formula to the DepthHouse Trading indicator, an indicator disclosed by oh92. (Thanks for this.)
** See support, resistance, and abbreviation points.
** Support or resistance is based on the closing price of the 1D chart.
** All descriptions are for reference only and do not guarantee a profit or loss in investment.
Explanation of abbreviations displayed in the chart
R: A point or section of resistance that requires a response to preserve profits.
S-L : Stop Loss point or section
S: A point or section where you can buy to make a profit as a support point or section.
(Short-term Stop Loss can be said to be a point where profit and loss can be preserved or additional entry can be made through split trading. It is a short-term investment perspective.)
GAP refers to the difference in prices that occurred when the stock market, CME, and BAKKT exchanges were closed because they are not traded 24 hours a day.
G1 : Closing price when closed
G2: Opening price
(Example) Gap (G1-G2)

FIL: Preparing to RiseVolume and spread analysis is showing a potential advance with Filecoin. I took an early preliminary at 56. One more retest of TR-R may be in order before the rally.
Like big wins and big money? Got strong hands and patience? Good! Same here.
I'm a full-time cryptocurrency swing trader (since 2017) and regularly seek out the most lucrative swings available on all the major crypto exchanges.
My win rates are between 80-85%. Follow me on TradingView and see for yourself.
All my charts are clean, straightforward, and easy to follow. No junk, no needless indicators -- just volume & spread analysis with simple 'take-the-money-and-run' Fibonacci target zones.
Good luck and safe trading!
** Not financial advice. Please trade at your own risk.

FILUSDLONG-TERM: Bullish bat with an adam and eve double bottom at the PCZ, with classic bullish divergence on the daily, and 4hr hidden bullish divergence + cup and handle. (not financial advice)


FIL - Going To Bounce?As per request
FIL has some bullish divergence with price moving sideways out of downtrend. Could have a bounce, but with BTC impotence would not expect a big bounce - maybe tag 0.382 and 200ma before moving back down.
Price could also simply continue to move down within the channel, but its looking like a bounce may be on.
Price found support for some time on 200ma but broke down and a death cross passed.

Filecoin (FIL) - July 16Hello?
Welcome, traders.
By "following", you can always get new information quickly.
Please also click "Like".
Have a good day.
-------------------------------------
(FILUSD 1W Chart)
If the price holds above the 53.9757257 point, it is expected that the uptrend will continue.
(1D chart)
We'll have to climb to the 63.0641658-77.2849855 section and see if we can find support.
If it declines at this rate, there is a possibility of entering the mid- to long-term investment area, so careful trading is required.
However, you should also be prepared for this, as it may touch the 34.0991707 point or the uptrend line and move higher.
It must move above the 77.2749855 point to continue the uptrend.
-------------------------------------
(FILBTC 1W chart)
If the price holds above the 0.0015437 point, it is expected that the uptrend will continue.
(1D chart)
If the price holds in the range of 0.0014371-0.0018899, it is expected to turn into an uptrend.
If it falls in the range of 0.0012107-0.0014371, it is possible to enter the mid- to long-term investment area, so careful trading is required.
------------------------------------------
We recommend that you trade with your average unit price.
This is because, if the price is below your average unit price, whether it is in an uptrend or in a downtrend, there is a high possibility that you will not be able to get a big profit due to the psychological burden.
The center of all trading starts with the average unit price at which you start trading.
If you ignore this, you may be trading in the wrong direction.
Therefore, it is important to find a way to lower the average unit price and adjust the proportion of the investment, ultimately allowing the funds corresponding to the profits to regenerate themselves.
------------------------------------------------------------ -----------------------------------------------------
** All indicators are lagging indicators.
Therefore, it is important to be aware that the indicator moves accordingly with the movement of price and volume.
However, for the sake of convenience, we are talking in reverse for the interpretation of the indicator.
** The wRSI_SR indicator is an indicator created by adding settings and options to the existing Stochastic RSI indicator.
Therefore, the interpretation is the same as the traditional Stochastic RSI indicator. (K, D line -> R, S line)
** The OBV indicator was re-created by applying a formula to the DepthHouse Trading indicator, an indicator disclosed by oh92. (Thanks for this.)
** See support, resistance, and abbreviation points.
** Support or resistance is based on the closing price of the 1D chart.
** All descriptions are for reference only and do not guarantee a profit or loss in investment.
Explanation of abbreviations displayed in the chart
R: A point or section of resistance that requires a response to preserve profits.
S-L: Stop Loss point or section
S: A point or section where you can buy to make a profit as a support point or section
(Short-term Stop Loss can be said to be a point where profit and loss can be preserved or additional entry can be made through split trading. It is a short-term investment perspective.)
GAP refers to the difference in prices that occurred when the stock market, CME, and BAKKT exchanges were closed because they are not traded 24 hours a day.
G1 : Closing price when closed
G2: Opening price
(Example) Gap (G1-G2)
FIL / USD - Double Bottom before Rally2H chart just confirmed a head and shoulders pattern. I've been expecting a strong rally following its 80% correction over the last few months. We've broken out of downtrends on both pairings, BTC and USD. We recently experienced a death cross on the 50/200 daily EMA and MA. The last time this occurred we saw a brief drop in price, followed by the strongest rally filecoin has had to date. I think it's about to happen again.
First, double bottom while re-testing the top of the trendline we broke out of, then rally. This chart is for the double bottom prediction alone, see related ideas in the links below.


FILKeep an eye on FIL
Currently sitting on wkly 50MA. Bull DIV. on Daily. watch for the daily stoch signal.

FILUSDT ewt analysisthis thing looks pretty bullish imo, and if btc does start moving up from here, we may be able to see some handsome returns down the road.
we're in pretty risky times though, so i can't recommend taking any leverage trades or anything. spot is the way, with a decent stop loss.
i have recently learned, that it is never about the reward that we might be able to receive, but it is about managing our risk, and protecting our capital at the end of the day.
💸

FIL / USD - Update on Breakout of Downtrend4H Chart here, displaying 50/200 daily EMA and MAs. We recently confirmed a death cross with our MA/EMA. Within days of our previous death cross, filecoin had a golden cross and rallied to over 230 dollars over the weeks that followed. Here we are again, just after breaking out of a nearly 90 day, 80% correction.
We either head up imminently, or it's possible that we re-test our bottom @ ~45 dollars while re-testing near the top of the trendline we recently broke out of, forming a double bottom prior to the rise. If we head down before up, I feel like the potential for greater gains exists. Meanwhile, I'm targeting a move back up to the 3 most recent fibs, and some resistances not shown here that are near the fibs. 112 and 124 seem like good targets if we can break 70 dollars, possibly a move up to 150-160s.

