what are you going to do with all that money?what are you gonna do with all that a&& all that a&& inside that trunk, I'm gonna get you to drunk. $43. before we head back down buy the dip. NFA
FILUSD trade ideas

Filecoin huge bull flag 🚀🚀We could see a break out as soon as tomorrow morning. Let the storage wars begin #FILUSD #FILECOIN #STORAGEWARS

FILUSD Forming a Beautiful Bullish PennantFilecoin has formed a textbook bullish pennant - large flagpole, consolidation before the next move. Look for a breakout on high volume, and potential retest before entry.

Massive selling pressure after the spike?Is it shorting, is it because of the minting? any explanation for the huge red volume after the most recent spike? comment below.

buy the dip; data storageeven after its dramatic 1x from the 2022 low, still a buy... not sure another project in the top 100 mkt caps can give you a better possible return than FIL next BR. NFA.

Filecoin fil - recovery not even started yetFilecoin - recovery not even started yet by taking a view on FIB from last ATH
positive: we see a regular bullish divergence on RSI
negative: we see a hidden bearish divergence as well
Speaking in ample steps:
red:
if we lose last volume support at $5.85
yellow:
if we reak price resistance at $11.87
green:
if we break above volume resistance at $22.35
What are your thoughts on fil dear Crypto Nation?
*not financial advice
do your own research before investing

FILECOINFilecoin is holding above the 200sma in the past 5$ if it can find the 11$ buyers and hold above 15 we could test the 200sma at 28

FIL - Storage Coins Leading The Day!Hello TradingView Family / Fellow Traders. This is Richard, as known as theSignalyst.
For those who know me well, know that I have been a big fan of Storage coins like FIL, STORJ, AR and many more...
After the big increase in FIL this week, Storage coins are getting the attention of many investors.
Coins related to Metaverse, Defi and many categories had their time. Will storage coins be the next movers?
Let's get back to our price action analysis ;)
on H4: Right Chart
the bulls took over after rejecting the 5.0 round number and breaking above the gray range.
now what?
on DAILY: Left Chart
FIL is trading inside our red channel, so yes we are still bearish from a long-term perspective.
For the bulls to take over from a longterm perspective, we need a break above the last major low and 20.0 round number.
but first we want a break above the upper red trendline to invalidate it and then be able to test the 20.0
Meanwhile, the bears can still kick in to form a new major swing high around the upper trendline.
in this case, the new swing high will be considered our trigger swing, and the bulls need to break above it for them to take over from a long-term perspective.
Always follow your trading plan regarding entry, risk management, and trade management.
Good luck!
All Strategies Are Good; If Managed Properly!
~Rich

Careful short on FILFilecoin did an amazin job once again.
I see few bearish flags on 15m chart, so I'll dive myself into shorting it. However, be extremely careful! Tight SL on it!
God knows where this could explode!
Trade safe, do your own research and learning!

FIL/USDTHello Traders,
Today we will discuss regarding FIL/USDT,
IMP bottom is in & price raising toward wave 3. its strongest wave & price will go up like rocket. My target of fill minimum is 500$.
If you still out of market wait & take entry after retest & hold up to 19$.
Thanks,
print money as you want with us.

FILUSD bottom forming Filecoin like many altcoins is forming the bottom. We don´t expect a big pull back as many altcoins already formed their bottoms and FILUSD is lagging behind but we expect it to form the bottom soon and pump towards the next strong resistance at 17 $.
However, with the strong bullish momentum (expected in the next weeks), we expect FIL to reach our mid-term target (27 usd) in August or early September.
Long story short:
-Accumulate FILUSD now
-take profit at 17 $
-Sell everything when reaches 27 $ and expect the pullback.
- Most likely BTC will be ranging what will give time for altcoins to rise in the next weeks

FILUSD short-term playAs we expected in our last analysis:
FILUSD has exited the accumulation zone and hit short-term resistance.
RSI is very overbought on 4h and 1h timeframes.
If you want to buy Filecoin, wait for a pullback.
Good luck

Breakout rise
fil breaks through the key pressure range
Expect a new round of gains here
Follow me to take you to achieve financial freedom

FILCOIN IS THE FUTURE EXASCALE OF DATA FIL & ZEC merge will be the future. Data is most valuable asset in existence. FIL is Farr beyond what Bitcoin & Eth ever was & will be. FIL is the Nexus of Web3.0 Inter operability, NFT, Meta verse & Blockchain tech Ext... Every industry will incorporate FILE-COINS Miscellaneous use case, frm Healthcare- to a baseball game A-Z will use Filecoin the same way a PC needs a uses i cloud storage now, but on a much more Safe-Proficient & Robust scale that along with Zcash will overtake , the entire industrial financial infrastructure & payment structure by storing Exascale quantities of data effortlessly & seamlessly.. Filecoin is the Nexus for the Quantum/Web3.0 era..

FILUSD ❕ expanding channelPrice has broken through the lower boundary of the expanding channel.
Trading volumes are low.
FIL ignored the reversal signal up the TD Sequential indicator (1H TF)
I believe that the asset is not enough liquidity for further growth, so after fixing under the lower boundary the price will go down.

FILUSD: adios muchachos, see you at the bottom.FIL, IMO, has a really ugly chart. Appears a bearish 'B wave' triangle is triggering which will send this crypto into the teens or, perhaps, single digits. Buyer beware..

FILUSDTREND IS upWARD
Possible to BUY
ratio 1:3
No need to care about other indicators such as RSI, MACD, MA, Stochastic.....

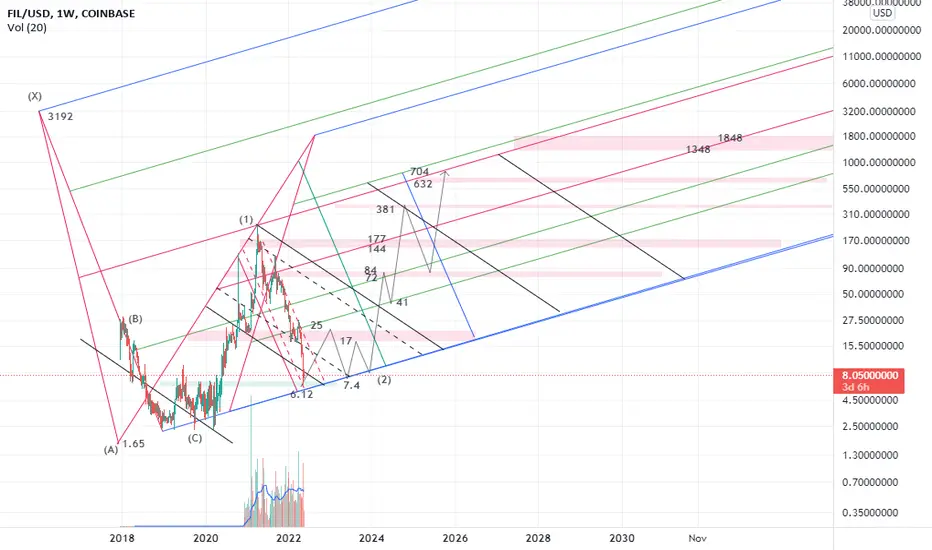
end of 2nd wave is nearbat harmonic pattern:
X=$3192
A=$1.65
AB=0.38 XA
BC=0.88 AB
0.38 BC=$6.12
0.23 XA=$9.87
0.78 BC=$17
0.88 BC=$22
0.38 XA=$30
1.13 BC=$41
0.5 XA=$72
1.41 BC=$84
*1.6 BC=$144
0.61 XA=$177
2 BC=$381
0.78 XA=$632
2.24 BC=$704
*0.88 XA=1348
*2.6 BC=$1848

FILUSD (1H) Bearish Wave LTFHi Traders
FILUSD (1H Timeframe)
A high probability, entry signal to go SHORT will be given with the downward break of 7.67 after the market found resistance at 8.73. Only the upward break of 8.73 would cancel the bearish scenario.
Trade details
Entry: 7.67
Stop loss: 8.73
Take profit 1: 4.84
Take profit 2: 3.25
Score: 8
Strategy: Bearish Wave LTF

FILUSDT 1DDue to the downturn that has occurred and the price has reached the bottom of its downtrend channel
The price is on a valid prz and confirms the positive divergence rsi can make an attractive profit in the long run
If the first prz is lost, the next resistance is in the range of 7.87 to 6.17
❌These analyzes are just to give a better perspective for you dear ones
Do not base on buying and selling❌

FILLooks to be a good place to accumulate FIL. 9 May be the bottom, well see. Using the Sin wave for help with timing.

Fil 2 week OutlookHello traders,
Here is a chart on FIl, Possibly one you have yet to see with such old price action. Yet, this as all the rest of the charts become very clear once you zoom out.
Green lines below are supports and areas of interest for buying opportunities. I have changed the support below to pink that we do not want to see the price cross below.
Red ray lines above are resistance and the white lines are targets for price action if the price breaks above the white trend lines holding the price action currently.
Savvy
