🔥 FILECOIN ARMY Now your Turn!Update to my previous post, it will take few more week before the "C" run or 3rd. Lets see how it goes, keep holding and Dollar cost averaging.
FILUSD trade ideas

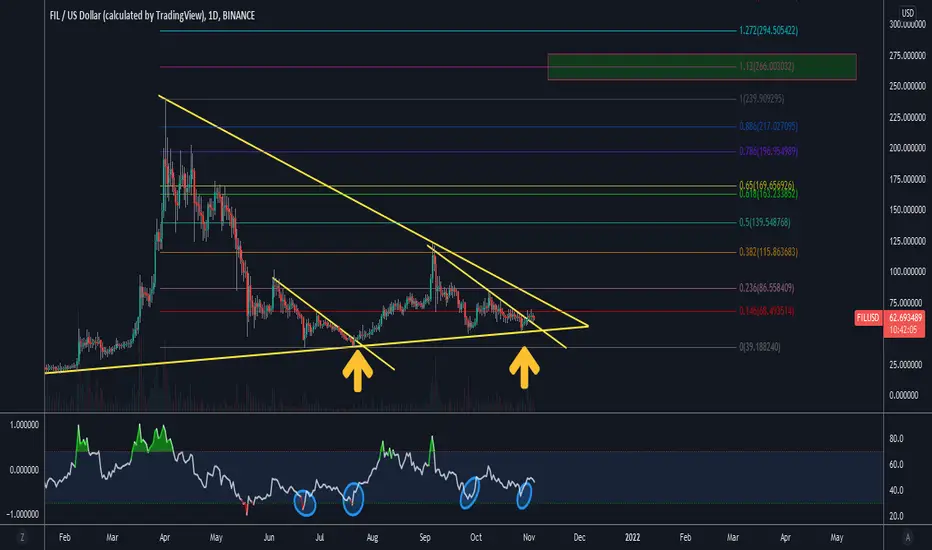
Will FIL Thrill on a Break Out or Wait Until...Watching these technical patterns for possible repeat of structure breakout.
Target $266
Swing TradeFIL had a huge run at the beginning of 2021. Not sure what happened but I guess the market deemed it was way overvalued.
Now it looks like it's trying to round out a bottom as it recently swept the prior lows. Bullish daily RSI divergence in play. Levels are on the chart but could be a pretty big swing trade in coming weeks

FILUSDT - 100% ?FILUSDT it ready to go UP
From this descending channel I expect it to make a small side channel and then break and climb, why not, even to get a 100% profit


FIL FILECOIN fully charged FILUSDT FILBTC FILUSDCFIL FILECOIN fully charged FILUSDT FILBTC FILUSDC
above $37 we may see vertical spike to $39

FIL BULLISH FILAs long as BTC or the SPX roll over, I think FIl coin can get some relief up to 45 from this falling wedge. At a major trend line and support line as well. If not and we break down, I will be looking for 28


Fil USDTBuy area 29$ 27$ Fil Usdt web 3 coin
Upcoming trend web 3
Good project all time high 240$
In dip now


FIL BULLISH FILIf BTC and ETH can maintain themselves or get a bounce, I think this falling wedge on FIL will take us to 46

FIL Bottom EntryFIL looks to be finding it's bottom here. It has dropped about 85% since ATH (about the exact same as BTC in each of it's bear markets). As BTC heads up to highs and beyond to close this bull cycle, expect FIL to make new highs as well. Long entry here returns over 6x+ in the coming months. Cheers!

FILECOIN HOPIUMOur falling wedge pattern broke down with BTC and ETH and we are currently sitting at major support. on the 4h, it looks like we are in the middle of a falling wedge breakout towards 45. Its possible that the overall picture though is a falling wedge on the weekly. The volume profile isnt ideal but its ok/. If this were valid, then the ATH would be the target

FILE COIN, What happened?File coin unfortunately broke down out of its falling wedge. These patterns usually have a high chance to break up but bitcoins breakdown gave it a turn for the worst. Many of the alt setups I had ended up breaking down instead as well. We are sitting at major support right now but I think its next moves are going to depend on BTC. If we can hold I think we will get a relief bounce to 48 from here. If not, we will revist the high 20's or 30. Emotions are extremely negative right now and there isn't a really a setup I see since the move just happened.

Filecoin will rise.Nice set up. Super fundamentals, Grayscale just bought for another few millions. Fil has not been nice recently from the charts, while everybody goes for hype coins like NFT´s. The narrative hasn´t changed whatsoever and storage will always be a huge problem, also for gaming and nft blockhains ;)
Anyway, I didn´t have the time to put in all my thoughts to this but I expect $FIL to break out to the up (and fake out to the downside just before to shake out all the margin trader). 3 RED LINES to show you the targets, last one at 81 USD.
Enjoy the ride.

Only hoping its this because am long ;)A running Triangle. Market takes Direction of B wave to complete the pattern. ABC zigzag. Risk Management in Place. Will take profits along the way if turns out that way. Can someone give me a bearish count ?

Bearish 3 Line Strike Spring and Back-Test Bullish DragonThis coin has got so many Bullish patterns on it above the weekly support it's ridiculous i would expect to see this rise up generously in the coming weeks.

FIL BULLISH FILJust a reminder that I'm still bullish on FIL coin from this falling wedge on declining volume to 90-120. Sorry I have not been available to post this last week or two but I have had a lot going on lately. Will try to get back into posting regularly next week

Accumulation ZoneNo telling when this coin will flip although it is my opinion that we are in the red zone of accumulation. For people who have the time to wait it out, a lot to gain if we see key levels break to new highs. Cost averaging is not a bad idea. LMK, what do you think?

FIL BULLISH FILI haven't changed on FIL. I'm still bullish on it to 120 when it breaksout from this falling wedge. A break down would easily take us to 40

FIL IF I WAS BEARISH I am not bearish on FIL coin but this is the best perspective I could come up with for why I might be bearish. The pattern is ok but it seems like we are neglecting the volume profile force this point of view. It would also imply we are about to go to 8 dollars which I just don't think is likely in the middle of a bull market. I am still very bullish and am not getting shaked out

FIL BULLISH FILAll of these dumps are just shake outs in my opinion. Hardly anything has lost market structure and most alts are still consolidating. I'm still bullish on FIL on this falling wedge on declining volume. I've tried making bearish argument but nothing convincing yet.
