Filecoin FIL Coin Price Prediction🔥 Price on the 4H chart might come at these support area and we might get a potential bounce🔥
Potential bounce areas for Buying 7.108 and 6.251
👉 Follow me for More Real Time Opportunities.
Share your Thoughts if you have any?
FILUSDT.P trade ideas

FILUSDT # 001 ( opportunity Grow to 15 $ ) Hello dear traders.
Good days .
On Supper Cycle of Gann Square, 1st Gann Square is Growing very weak which is 1st Elliot Wave of supper cycle .
On weekly Gann Square, As is showed , till Mar-2024 it will finish and FILUSDT will test and Hard resistance Gann Fan line which will be on 0.25 Gann Box Fib level .
Chart updated and route plotted with help of Gann Square and Gann Box.
Good luck and safe trades.
Thanks for your support and comments

time to go upi have illustrate all the info you need ... this is just my own opinion and there is not a trading advice .... do whatever you want to do on your own risk ... by the way ... crypto market is always has a consecutive runways ... so don't try to be exact on it .
📊#FIL may continue to rise based on the double bottom structure➡️After a long decline, we constructed a smiling face bullish structure and a small double bottom structure at the bottom, and used this as support to start rising. When we reached the mid-term TP zone, we started a sharp correction, which was very reasonable. Because the realization of macro-cycle goals is often accompanied by macro-cycle adjustments. When we pulled back to fib0.5, we re-established a double bottom long structure, so I have reason to think that we will continue to rise next.📈
🧠If we can successfully break through the short defense point above, then there is a high probability that we will challenge the previous high. If the previous high is broken, then a higher target is worth looking forward to. So it's important to be patient.☕️
⚠️But to be conservative, we will first lock in about 50% of the profit. If we do not continue to break through the short defense point above, our position is not heavy, so the corresponding risk is also reduced. If we continue to break through the short defense point above, but do not continue to break through the previous high, and then start to pull back, we will look for opportunities to add to the position.⚙️
🍻I have helped everyone make money, so I hope you can also help me. Please remember to like❤️share my analysis posts and channels. 📤
💕 Follow me so you don't miss out on any signals and analyze 💯

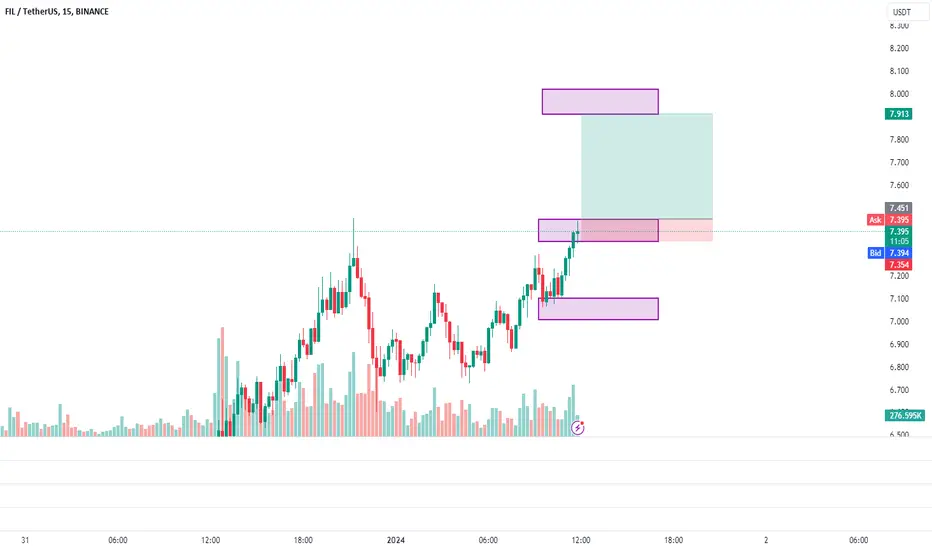
FIL/USDT BUY NOW!!! 10.2 INCOMING!!!!!!!!!FIL just took out the buyside liquidity and price is ranging above the FVG zone am expecting another breakout structure from current resistance of 7.5 then price should maintain uptrend stability till 10.2 target is completed

Filcoin,, my Target FileCoin can still grow after crossing the previous ceiling, and the price will go up.

[FILUSDT] - unstoppable bullish 🔥🔸Weekly chart looks cheerful
🔸Weekly close directly below the major trend..... doesn't happen before
🔸Double bottom consolidated .
🔸Need to confirm breaking out the down trend to reach my target (50$)
Dont forget to support us with ur like,comment and follow for more ideas.🎯

Bullish on $FilInstead of chasing alt that already gone up 300%, pick those that are building momentum. Fil is one of them, obv coming in nicely, I am bullish as long as it stay above the support line. First major target $10.


FILL ENTERING NEW UPTREND VOLUMEThank you for reading this update.
Depending on our study we see that FILL has a good chance of volume increase.
This updates depending on day trade, And the market should confirm with time the right market way.
#Nottradingadvice
#For Day traders take always profits when the market increase
#Expect nothing from the markets, but follow what it shows.

FILUSDT Long/Short Just an IDEA !!!FILUSDT is at perfect buy zone n testing the resistance as of now, a breakout with good volume can pull FIL till 26$, this bull cycle it can pinup till 180$, NEVER MISS FILL...
NAFA n DYOR
ThankYou....

Fillcoin . Tecnicall analysis 📈📉The filecoin breaks its long-term trend line and can cross the cloud and go to higher areas. 📈📉

FILUSDT.PI took a position as it looks like. Not a bad position in terms of scalping and R.
The supply zone broke before us without any work, the test of this place will come. Right now it's a demand zone, but it will test it.


FILUSDT 30-50% upwards Long FILUSDT
PRO:
Bullish convergence on 1-4h timeframes,
bullish flag,
200ma average touch and
BTC ETF approval expectations
all together are intended to move the market further along the bullish trend.

Another Brutal Filecoin Rejection: Crash Imminent!Another Brutal Filecoin Rejection: Crash Imminent!
The chart speaks for itself. Every coin has done 500% minimum but filecoin can't even 1.5x in ultra bull market conditions. Extremely weak!

FILUSDT.1DBased on the provided market data, the FIL/USDT pair is currently trading at 6.039 USDT.
In the 4-hour chart, the Relative Strength Index (RSI) is at 61.47, suggesting that the market is slightly more towards the overbought territory. The Moving Average Convergence Divergence (MACD) is positive, indicating a bullish trend. The Bollinger Bands (BB) are at 6.319, suggesting a moderate degree of price volatility. The support levels are at 5.585, 5.412, and 4.857, while the resistance levels are at 6.273, 7.040, and 7.340.
In the daily chart, the RSI is at 70.91, indicating that the market is in the overbought territory and could potentially be due for a correction. The MACD is also positive, suggesting a bullish trend. The BB is at 6.322, indicating a moderate degree of volatility. The support levels are at 5.373, 4.471, and 4.282, while the resistance levels are at 6.760, 7.353, and 7.649.
In the weekly chart, the RSI is at 68.05, indicating that the market is slightly in the overbought territory, suggesting that the market could potentially be due for a correction. The MACD is positive, indicating a bullish trend. The BB is at 6.330, suggesting a moderate level of volatility. The support levels are at 4.130, 2.690, and 2.423, while the resistance levels are at 6.800, 9.400, and 11.215.
In summary, the market data suggests a bullish trend for FIL/USDT in the short term. However, the relatively high RSI values in the daily and weekly charts suggest that the market could be due for a correction in the medium to long term. As always, this analysis should not be taken as financial advice and individual research should be conducted before making any investment decisions.

fılIt has reached a big wedge on the weekly chart. If it breaks the wedge, a big rise may occur.
But if she can't break it, she'll go down again
You need to wait for it to break before opening a position.

filIn the first step, by keeping the green line, it can rise little by little
In case of failure, it can be checked in the green box

#FIL +300% PROFIT IN Q1-2 2024#FIL Looks Promising here for the MidTerm ENTRY 📈📈..
In case of Major Trendline Breakout, Expenting +300% Bullish Rally in the Q1-2 2024.

Mock Up Price Action for FIL | Mid Term (12HR)Mock Up Price Action for BINANCE:FILUSDT | Mid Term (12HR)
- Watching and waiting for opportunities
Personal Approach & Base Chart Setup
- Stacked Parallel Channels for Grid of Confluence Points
- High Time Frame (HTF) Fib Extensions, Retracements, & Time Cycles
- Red Filled Horizontal Rectangles between areas of major Fib level from Extensions and Retracements
- Price Label Callout with Red Circle highlighting points of interest where I'd consider making a trade
- I will consistently monitor and adjust taking into consideration long/mid/near term price action and market conditions/news

Filecoin investment ThesisFilecoin the decentralized storage mogul has broke above a long term supply ,From the shift of trend am anticipating a bullish run to new levels.
And the idea that the bull run is upon us i anticipate large ROI

fil is ready5 dollars was achieved, the next target is 8 dollars, the heat rises there until we reach 14 dollars
