Filecoin 01this is my first from analysis FileCoin FILUSDT.
FIL is in a compact area, it can move to up.
FILUSDT trade ideas

animation chart of filcon easy to use
You can look now, but later you can be in danger or be saved just by looking

Forming a base at weekly chartFIL / USDT is forming a base in weekly chart. Im expecting an uptrend to start soon.
Good price to jump in with target of 10$ and 12$ in the next 40 to 60 days.
DOYR


FIL/USDTHey traders👋
FIL coin is going to be a starter of the day! We see that FIL coin struggles to show any bullish signs here where price gets surpassed all the time it even tries to go for a little bullish run!
We do see a good chance for some bearish further drop to happen! so we are keeping an eye!
If you like ideas provided by our team you can show us your support by liking and commenting.
Yours Sincerely,
Swallow Team
Disclamer:
We are not financial advisors. The content that we share on this website are for educational purposes and are our own personal opinions.

FILUSDT is creating a falling WedgeIn the FILUSDT market, we are observing the formation of a falling wedge pattern on the daily timeframe, with the lower boundary of this pattern currently at the $2.740 level.
The falling wedge pattern typically signifies a period of consolidation and decreasing volatility within the market. Traders often pay close attention to such patterns, as they can provide valuable insights into potential price movements.
At the moment, the price of FILUSDT is approaching a critical point at $2.750, which is the upper boundary of the falling wedge. However, it's crucial to be cautious, as there is a possibility that the price may experience a false breakout beyond this level. False breakouts occur when the price briefly moves beyond a key resistance or support level but then reverses.
In accordance with Plancton's trading rules, traders should be prepared for the possibility of a false breakout. It's essential to remain patient and not rush into positions prematurely.
If the price does indeed manage to break out of the falling wedge pattern, it may signify a shift in market sentiment and a potential trend reversal. This could attract new liquidity into the market, prompting traders to consider long positions.
–––––
Follow the Shrimp 🦐
Keep in mind.
🟣 Purple structure -> Monthly structure.
🔴 Red structure -> Weekly structure.
🔵 Blue structure -> Daily structure.
🟡 Yellow structure -> 4h structure.
⚫️ Black structure -> <= 1h structure.
Follow the Shrimp 🦐

FILUSDT fractal pattern 130 % pumpFilecoin is very undervalued now.
On the chart you can see the fractal pattern which we expect to play out in the summer.
Filecoin should rise around 130 % from the current levels (4 $ ) .
Final target: 9,30 $
We expect this move to occur in the summer.
It's still early to load up on Filecoin.
Some altcoins already have had their pump. Look at COMP or BCH . Probably Filecoin will consolidate a bit more but overall it's very likely that in the next weeks we see a big pump.
We are buying filecoin today. Do you?
Good luck

FIL/USDT 4H: ready for short positionIn the daily time frame, we can see that after breaking the trendline, it could not cross the static resistance (flip zone) and take back the last top
Weakness in price stabilization is evident
In the 4H time frame, we have an upward trend line that the price has penetrated twice and is currently moving tangentially with it. There is also a support zone that has prevented the price from falling
If the trendline and the support zone are broken, we can enter the short position in this area in pullback (according to the drawn scenario)

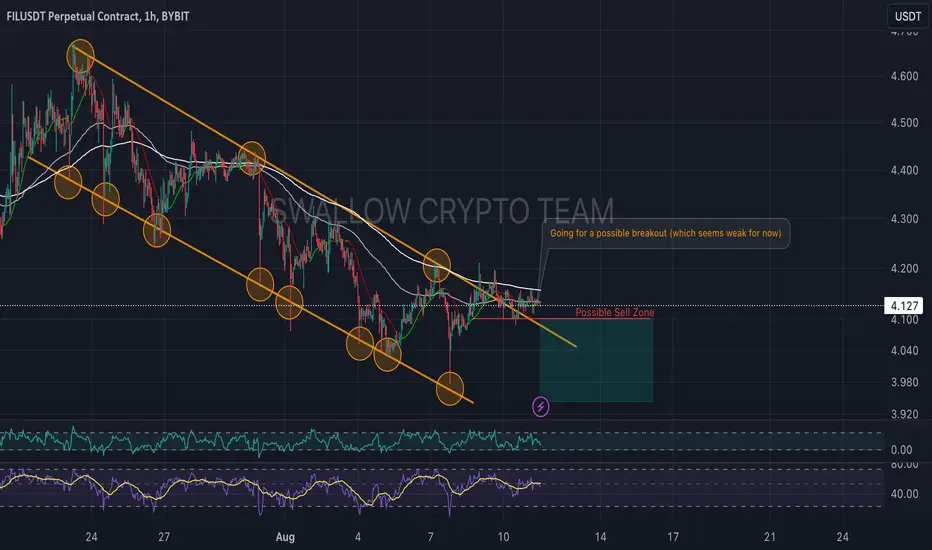
FIL/USDT Breakout or Fakeout? Hey traders 👋
FIL coin is next on our watchlist with an attempt to go for a breakout but still behind the 200EMA line. We are looking here at an potential breakout attempt but for now it seems weak which can mean that this one will fail and we will go back to that small bearish trend we have on 1 hour! - Keeping eyes opened here!
If you like ideas provided by our team you can show us your support by liking and commenting.
Yours Sincerely,
Swallow Team
Disclamer:
We are not financial advisors. The content that we share on this website are for educational purposes and are our own personal opinions.
FILUSDTBINANCE:FILUSDT LONG
⚠️Note:
In this type of signals, only the entry point and trade direction are specified, and stop loss and target are not determined.
If you are interested in entering these signals, please provide a stop loss and a logical market-based target.
⛔"Daily crypto market analyses I provide are personal opinions & not financial advice. Trading carries risks, so do your own research & seek advisor's help.#DYOR"
Don't forget to like and comment

Filecoin: Looks Like Bears Are Gonna Dump It More?This is my analysis on BINANCE:FILUSDT , have a look at it.
Risk-to-Reward of 2.8 looks great when the support is broken.
You are probably gonna lose $1000 or make $2,800 from this setup.
Guys, let me know your thoughts on this analysis.
Finally, Follow me on Tradingview.

#FILUSDT #LQR #TOBTC #LaqiraProtocolThe price is below the dynamic resistance. The support is specified in the chart. If it is confirmed and matched with Bitcoin levels, you can open long positions. If breakdown support and confirmation, you can open to lower support. This analysis is not suggested to buy or sell

FIL: Ascending Triangle BreakoutFilecoin (FIL) technical analysis:
Trade setup : Bearish breakout from Ascending Triangle, in the direction of existing downtrend, signals further downside risk. Price has now also broke below $4.00 support and the next major support is around $3.00 where it bottomed in June.
Trend : Downtrend across all time horizons (Short- Medium- and Long-Term).
Momentum is Bearish (MACD Line is below MACD Signal Line, and RSI is below 45).
Support and Resistance : Nearest Support Zone is $4.00, which it broke, then $2.75. The nearest Resistance Zone is $5.00, then $6.50.

FILUSDTI put my last chart about DOT in down this chart.
Like other chart we have a broken support zone .

FILCOINWell
As chart said, breaking down from a triangle waiting for TP .
Monitor news about UKRAINE and Russia 🤦♂️


#FIL_USDElliott wave analysis
bullish count sub-wave 3 on major wave 3 uses law time frame conformations

Short positionThe price can go up a bit to collect more liquidity
Then come down
In general, the trend is downward

FIL/USDT - Potential Trend Reversal to BullishAfter printing consistent LHs and LLs FIL/USDT has formed a bullish divergence along with a falling wedge which seems to suggest it may reverse the trend to bullish. The suggested plan would be to take a buy-stop entry at the last LH breakout.

FILUSDT - Potential Bullish Opportunity! 🚀 FILUSDT - Potential Bullish Opportunity! 🚀
📊 Technical Analysis:
- 1-hour chart shows a clear downtrend in FILUSDT.
- RSI indicator is displaying a bullish divergence, hinting at a potential reversal.
- A bearish falling wedge pattern is forming, signaling a potential trend reversal.
📈 Trade Plan:
- Buy Stop Entry (Above Last LH): $4.165 🎯
- Stop Loss (Below Last LL): $4.041 ❌
- Take Profit (1:1): $4.288 🎯
- Projection Range: $4.122 - $4.360 📈
📉 Risk Management:
- Risk-Reward Ratio: 1:1 ⚖️
- Only invest what you can afford to lose 💰
- Use appropriate position sizing to manage risk 🔍
📝 Investment Advice:
The provided technical analysis suggests a potential bullish opportunity in FILUSDT. However, always exercise caution and perform your own research before making any investment decisions. Remember to set a stop-loss to protect your capital.
Disclaimer: This post is for educational and informational purposes only and should not be considered financial advice. Trading involves risks, and past performance is not indicative of future results. Always do your own analysis and seek professional advice if needed. #DYOR #InvestResponsibly
Let's stay sharp and take advantage of the market opportunities! Happy trading! 📈🚀 #CryptoCommunity #TradeSmart
📈 #CryptoTrading #TechnicalAnalysis #FILUSDT #BullishDivergence #FallingWedge


FIL/USDT | 4h 👀
1. Filecoin appears to be preparing for a significant upward movement.
2. The price is forming an ascending triangle pattern on the 4-hour timeframe, indicating a potential breakout.
✅ Stay updated on market news and developments that may influence the price of Filecoin. Positive or negative news can significantly impact the cryptocurrency's value.
✅ Exercise patience and discipline when executing your trading plan. Avoid making impulsive decisions driven by emotions, and adhere to your strategy even during periods of market volatility.
✅ Remember that trading always involves risk, and there are no guarantees of profit. Conduct thorough research, analyze market conditions, and be prepared for various scenarios. Trade only with funds you can afford to lose and avoid excessive risk-taking.
#Cryptocurrency #Crypto #Coins #Altcoins #Finance #Trading #FIL #Cryptomarket #Filecoin #Futuresr
