FIL 17-22$ in no timeI see FIL at 17$ in no time. Same as DOT he is trying to flip previous resistance zone as support.
FILUST trade ideas

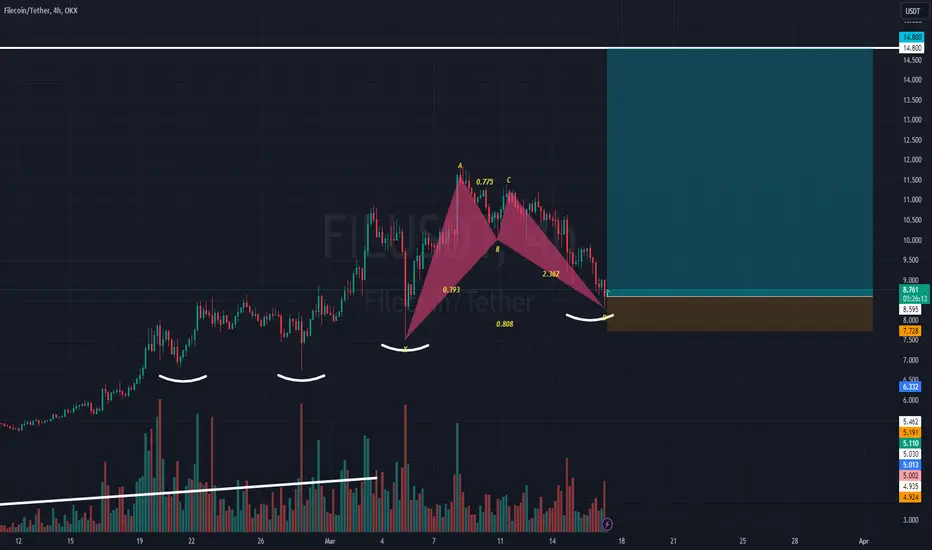
Bullish Bat Reversal Harmonic- $FIL 4HRBullish Bat Pattern was detected on the 4 hour timeframe for Filecoin:Tether on Tradingview, on March 22nd, 2024, @ 3:43AM. A 161.8 percent Fibonacci extension/return is expected.

FileCoin at H2 FileCoin possible path, I think it will break last high at 11.8$.
we have good engulf canlde and support area.
now FileCoin has pullback to support area.
BINANCE:FILUSDT

FILCOIN Short PostionI anticipate that Filcoin will experience an hourly fair value gap, which I expect to be filled completely. Once the gap is rejected, I believe the price will decrease. Therefore, I have taken a short position.

Tasty levels on weeklyFil has been on basement levels for ages now. Using resistance from early 2023 as support for the first time. Reversal candle on the weekly could see run to the higher prices. Move will take some time since it is in the weekly chart but something to watch out for.

📈 FIL Trade Analysis 📉💡 Trade Plan:
Entry: Consider entering a long position at the current level, indicating support reclaim around $8.88.
Take Profit: Plan to take profit at resistance levels of $11.10 and $15.50 to capture potential gains.
Risk Management: Set a stop-loss just below the support level, possibly below $6.96 or $5.86, to manage potential losses.
🚀 Important Note: Stay updated with market developments and adjust your strategy accordingly. Keep an eye on FIL's price action and broader market trends for informed decision-making.

FILUSD 1 Hour Chart Bearish TrendAs we can see File coin prints LH and LL forming a bearish trend in 1 hour chart.

Will FileCoin hit the target?The $6-$7 range is likely to be a solid support zone for Filecoin, and it could reach levels above $15 once the time correction is over.


📉 FIL Trade Analysis 📈📊 Market Overview:
Token: FIL (Filecoin)
Current Situation: FIL is retracing into a key support zone marked by the Fibonacci 0.618 level and previous high timeframe resistance.
Trading Approach: Observing buying pressure in this zone to trigger a spot buying opportunity.
💼 Trade Setup:
Entry Range: Consider entering the trade between $7 to $8, aligning with the key support zone and potential buying pressure.
Target Price: Aim for a take-profit range around $13 or $16.5, reflecting potential upside targets based on previous price action and resistance levels.
Risk Management: Implement a stop-loss strategy to exit the trade if the price closes below the critical support level, set at a daily close below $6.
📈 Rationale:
Key Support Zone: The Fibonacci 0.618 level and previous high timeframe resistance act as a significant support zone, attracting buying interest.
Buying Pressure: Observing for signs of buying pressure, such as bullish candlestick patterns or increasing volume, to confirm the validity of the support zone.
Upside Potential: Potential upside targets are based on historical price movements and resistance levels, providing achievable profit objectives.

⚡ FIL Trade Setup ⚡📊 Analysis:
Market Observation: FIL shows continued bullish momentum, breaking resistance and retesting it as support.
Current Situation: The retest of support at $10 offers a potential entry opportunity.
Strategy: Wait for confirmation of support holding before entering the trade.
Entry Point: Consider entering the trade between the range of $10 to $11.
Take Profit: Target profit levels at around $13 or $16.5.
Stop Loss: Set a stop loss just below the support level, below $9.50, to manage risk.
🌐 Note: Ensure to wait for confirmation of support holding before entering the trade. Monitor the price action closely for signs of a change in character. Adjust the strategy based on market movements and consider factors such as volume and overall market sentiment.

FILUSD 5DFIL ~ 5D
#FIL Support Retest successful, Make gradual purchases from here, with a minimum target of 20%++.

FilUsdt- I'm expecting a new leg upFilecoin is one of the coins that I anticipate will perform very well in the coming months. Like the entire cryptocurrency market, BINANCE:FILUSDT began a bullish trend at the end of October.
However, at the start of this year, the coin entered a correction phase, experiencing a drop from above 8 to under 5.
In mid-February, a new upward trend began, and the coin surged by more than 100% once again. Following the peak around 12 on March 9th, the coin started to correct once more, with a recent low reaching 8.3.
Technically, the 8 zone should offer strong support, while the 10 zone should act as resistance at this time. If this cycle were to continue, we could expect a new upward movement to the 17-18 zone, which is an important resistance area visible on longer timeframes.
In conclusion, I maintain a bullish stance on Filecoin as long as the price remains above the $8 USD zone, and I anticipate a new upward movement of around 100%.

FILThe rejection on the 4 hr higher time frame support zone suggests that the price of Filcoin will increase.
FileCoin to 120$ at 1st step. After weeks of downtrend and now range, the FileCoin is ready to grow and began to Uptrend.
According to analysis, we expect FileCoin reach to 1st target at 120$.
soon we say about 2nd Target.
Maybe it will go down about 5 dollars but our 1st target is 120$
BINANCE:FILUSDT

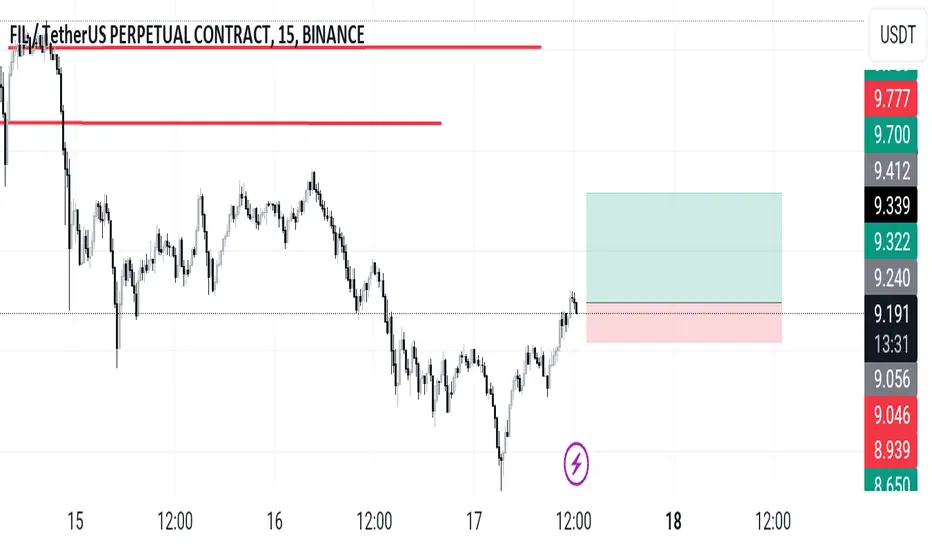
FILUSDT AnalysisAfter a correction over the past two days, FILUSDT shows signs of stability and seems ready to resume its upward trend. Using a price block approach, I've identified an interesting buying level at 8.93, located within a strong support zone.
Key Points:
Buying Level: 8.93
Profit Target 1 (TP1): 11.25
Profit Target 2 (TP2): 11.85
Stop Loss: 7.55
Technical Analysis:
Buying Level: The buying level of 8.93 corresponds to a key price block where demand seems to be particularly strong. This area has previously acted as a solid support, reinforcing its relevance as an entry point.
Profit Targets: Profit targets have been set at 11.25 (TP1) and 11.85 (TP2) based on previous resistance levels. These levels offer opportunities to realize significant profits while accounting for potential market volatility.
Stop Loss: The stop loss has been placed at 7.55 to limit losses in case of a market reversal. This level is located below the entry point and is based on a risk-reward analysis to maintain prudent capital management.
Conclusion:
In summary, the FILUSDT analysis suggests an attractive buying opportunity, with a well-defined entry level, clear profit targets, and a stop loss to manage risks. This price block and demand zone-based approach provides a solid framework for making informed decisions in the market.


Bullish Alternate Bat: 4-Hour Filecoin ReversalPotential Reversal spotted on the 4-Hour for filecoin here. This token has experienced a similar uptrend relative to the other coins in the alt-coin crypto markets, and as such is going to continue, me thinks. Bullish Alternate Bat was discovered on the 4-Hour timeframe, with a PRZ well within respected parameters, assuming it does in fact reverse here. I placed a long position tool to chart it's ascent, level by level.
Filcoin at 4h chartWe can see a pump, when the price will takes the order block. Its a bullich since


$FIL Elliot Waves Analysis$10.018 could be a good buying level, given it's a strong support level. I'm assuming it to be the end of wave 4, as a throw over, and wave 5 will be flipping up the pathway.
Disclaimer: Opinions are my own.


FILCOIN UPDATEFIL / USDT
Price pumped by +91% since my last analysis (check attachment below)
Today after BTC correction we see FIL is setting right on 2nd major S/R
stability above here is strong bullish
if No BTC drama i see this moon soon
Note : in short term price can fluctuate up and down..focus on HTF
