FIL Approaching Key Breakout Zone on Higher Timeframes🚀 LSE:FIL – Breakout Watch
📅 Daily timeframe shows FIL breaking above a descending resistance line ✅
📈 Weekly view highlights a sharp bounce off the $2.4 support after exiting an ascending channel. Now, price is pressing up against a major descending trendline.
📍 A breakout here could ignite strong bullish momentum.
👀 Eyes on FIL — this setup looks loaded for a move!
FILUST trade ideas

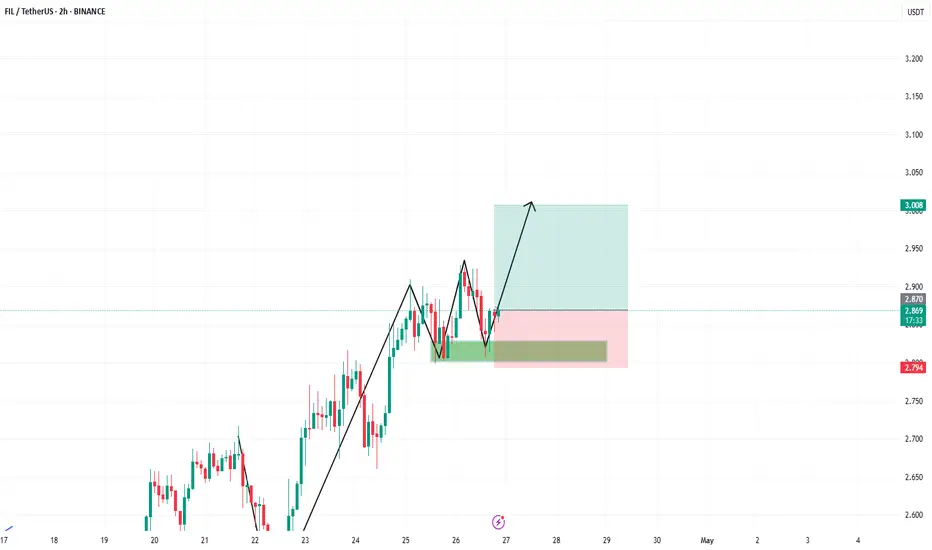
FILUSDTFIL is showing signs of a potential trend reversal 📊
Price has formed a higher low and is now approaching the key resistance at 2.485 USDT. A breakout above this level could open the way toward the next major zones around 2.887 and even 3.189 USDT 🚀
However, if rejection occurs, we might see a pullback toward the 2.272 USDT support area 🔁
Currently, momentum is leaning bullish and favoring a move higher, especially if the descending trendline gets broken with strength 💪

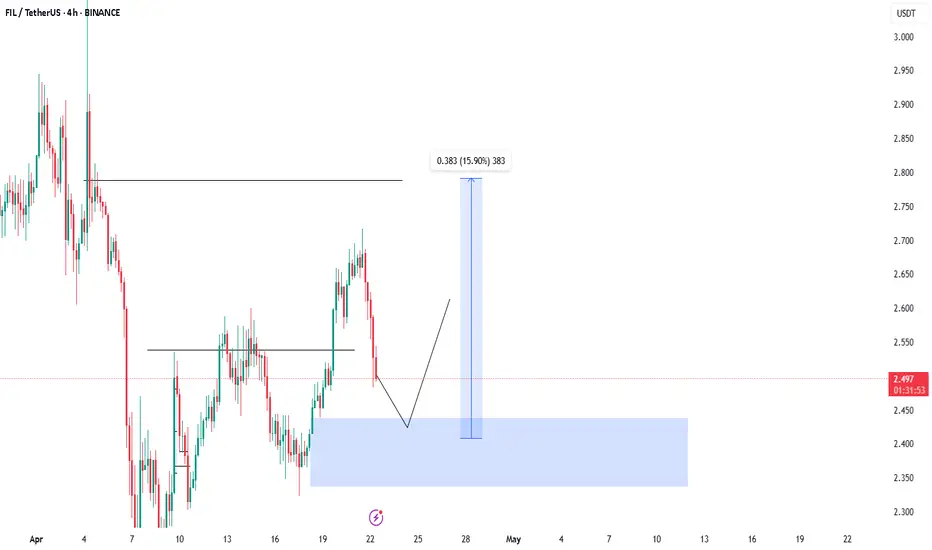
FIL bull-pollbakThe Filecoin ( BINANCE:FILUSDT ) chart, after a correction to $2.65, is attempting to pull back to the broken level around $2.77. If it fails to break this resistance, another decline towards support levels at $2.525 and then $2.39 is likely, which could act as a potential starting point for a new upward movement towards targets at $3.02 and $3.30.
🔑 Key Zones on the FIL Chart:
Primary Resistance: $2.77 (Pullback to broken level)
First Support: $2.525
Second Support: $2.39
First Bullish Target: $3.02
Second Bullish Target: $3.30

A basic password must be in the basket...You can buy spot here with a specified stop loss and profit limit.
Allocate 10 to 15 percent of your portfolio to this cryptocurrency, because it is good both fundamentally and technically and has a good future.
.
.
.
.
I hope you liked our team's analysis completely, follow our page to see more analysis.

#FILUSDT - bottomed out!On the weekly timeframe, the downward trendline has been broken and successfully retested.
A strong move upward is just a matter of time…
Notice how it bounces hard every time it touches the support zone marked by the grey rectangle — this has happened three times in a row.
Also, FIL has been in an accumulation phase for around 1,092 days — that’s nearly 3 years.
$28 is a target I'm fully confident in for this coin.
Best Regards Cecilion🎯

FILUSDT Potential UpsidesHey Traders, in today's trading session we are monitoring FILUSDT for a buying opportunity around 2.60 zone, FILUSDT is trading in an uptrend and currently is in a correction phase in which it is approaching the trend at 2.60 support and resistance area.
Trade safe, Joe.

filNothing is visible in this channel at the moment
We had a bottom in the green box that was broken and I marked the end of its movement with the blue line. The end of the movement that can be considered for it in the medium term is the red lines
Now, depending on the market conditions, it is up to you to decide
And if a launch is to be made, the ceiling of the channel can be available in the first step
But any step-by-step purchase with controlled volumes, I think, can be appropriate in the reversals and place your stop below the blue line

Filecoin 5X Lev. Full PREMIUM Trade-Numbers (PP: 3130%)Another day, another amazing trade.
My fellow Cryptocurrency trader, I hope you are having a wonderful day.
Timing is key. Timing is everything.
Timing and a great entry.
Let's all wait when the market advances and turns green; that's ok, we can wait.
Let's rush-in when the market turns red, that's the best time to enter such a low risk but potentially highly profitable trade.
Filecoin is one of your favorites and I am sharing a set of full trade-numbers with you today.
The numbers below are capped at $18.6, a medium sized wave. But we all know this isn't the entire bull market.
$18.6 yields 626% profits from current prices. That's a huge 3,130% with 5X.
If we consider the number on the chart, a strong target for 2025, potential can go as high as 13,165% with 5X. These are huge numbers; leveraged trading is for experts. You decide how to approach this chart, these numbers and these targets.
You deserve the best you know?
The market will give you as much as you can take and hold.
If you can handle millions, the market has millions ready for you. If you can handle thousands, the market is ready to give you as much. There is no limit truly, even the giants are trading Bitcoin with billions upon billions and making their money grow.
You want tens of millions or hundreds of millions?
The market is liquid, if you can take it it is yours.
Full trade-numbers below:
_____
LONG FILUSDT
Leverage: 5X
Entry levels:
1) $2.60
2) $2.45
3) $2.30
4) $2.12
Targets:
1) $2.70
2) $3.04
3) $3.60
4) $4.52
5) $5.26
6) $6.01
7) $7.07
8) $8.42
9) $9.91
10) $10.8
11) $12.3
12) $14.7
13) $16.4
14) $18.6
Stop-loss:
Close weekly below $2.10
Potential profits: 3130%
Capital allocation: 5%
_____
Thank you for reading.
I am rooting for your success.
I am wishing for you great profits... Can't wait for the market to take off, it is exciting, the build-up phase.
Patience is key.
Namaste.

#FIL/USDT#FIL
The price is moving within a descending channel on the 1-hour frame and is expected to break and continue upward.
We have a trend to stabilize above the 100 moving average once again.
We have a downtrend on the RSI indicator that supports the upward move with a breakout.
We have a support area at the lower limit of the channel at 2.60, which acts as strong support from which the price can rebound.
Entry price: 2.64
First target: 2.72
Second target: 2.78
Third target: 2.87

FILUSDT Analysis D1FILUSDT Looks Bullish So Far Falling Wedge Breakout, Retest Done, Horizontal Resistance Breakout, Retest Done, Another Trendline Breakout, Retest Done So Whats Next? In My Point Of View Rally Towards 5$ .

#FIL/USDT#FIL
The price is moving within a descending channel on the 1-hour frame, adhering well to it, and is heading towards a strong breakout and retest.
We are seeing a bounce from the lower boundary of the descending channel, which is support at 2.68.
We have a downtrend on the RSI indicator that is about to be broken and retested, which supports the upward trend.
We are looking for stability above the 100 moving average.
Entry price: 2.73
First target: 2.78
Second target: 2.86
Third target: 2.95

FILUSDT 1D#FIL has broken the falling wedge pattern to the upside on the daily chart and now is on the verge of breaking out above the daily EMA50. Looks promising. Send #FIL to the $6. Targets are:
🎯 $3.602
🎯 $4.523
🎯 $5.268
🎯 $6.013
⚠️ Use a tight stop-loss.

FILUSDT – Breaking Downtrend and Eyeing Higher LevelsFILUSDT has recently broken out of a sustained downward momentum channel, which had been suppressing price action since early 2025. The breakout is visible with a clean move above the descending resistance line, suggesting a potential trend reversal.
Currently, the price is trading around $2.77, supported by the EMA/SMA crossovers, which are beginning to turn bullish. The MACD indicator at the bottom also shows a bullish crossover, strengthening the buying signal.
Trade Setup
Entry Position: $2.70 – $2.77 (current range)
TP1: $3.57 (near recent structural resistance)
TP2: $8.43 (major resistance zone visible on the chart)
Stop Loss: $2.30 (below recent support and the breakout zone)
The setup offers an attractive 2.37x reward-to-risk ratio, aligning well with proper risk management strategies.
Key Technical Highlights
Breakout from a long-term downward channel ✅
Bullish MACD crossover ✅
Support from Moving Averages (EMA/SMA) ✅
Clear higher low formation beginning post-breakout ✅
Fundamentals of Filecoin (FIL)
Filecoin (FIL) is one of the strongest Web3 projects focused on decentralized storage solutions. It aims to revolutionize how data is stored and retrieved on the blockchain by offering a decentralized alternative to cloud storage giants like Amazon AWS and Google Cloud.
Key Metrics
Market Cap: $1.83B (+1.90%)
24h Trading Volume: $81.96M (+24.70%)
Fully Diluted Valuation (FDV): $5.43B
Holders: 154.59K
Circulating Supply: 662.74M FIL
Total Supply: 1.95B FIL
Filecoin hit an all-time high of $237.24 on April 1, 2021, but is now down about -98.83% from that peak. Meanwhile, it is still up +51.31% from its all-time low.
The strong fundamentals, combined with increasing enterprise interest in decentralized storage, suggest that Filecoin is well-positioned for a recovery during the upcoming Web3 cycle.
Why Web3 and FIL Could Boom Together 🌐
The Web3 sector is primed for massive growth over the next few years, fueled by user demand for decentralization, transparency, and data ownership. Major Web3 projects like Polkadot (DOT) and Chainlink (LINK) are setting the foundation for next-generation blockchain infrastructure—and Filecoin perfectly complements this ecosystem by offering secure decentralized storage.
As enterprises, governments, and consumers move away from centralized systems, projects like FIL, DOT, and LINK are likely to see increased adoption, making them top contenders for the next bullish wave.
Final Thoughts
With the technical breakout, strong fundamentals, and a booming Web3 trend, FILUSDT presents a promising bullish opportunity. However, always practice proper risk management and adjust position sizing based on personal risk tolerance.
⚡ Watch closely for a potential move toward $3.57 in the coming weeks!

Bullish Technical Analysis for FIL/USDT📈 **Bullish Technical Analysis for FIL/USDT**
Current Price: **2.769 USDT**
✨ FIL is showing signs of a potential breakout from the previous bearish trend, as indicated by the upward price path and key target levels.
🎯 **Target Levels:**
1️⃣ **3.601 USDT**
2️⃣ **4.926 USDT**
3️⃣ **8.496 USDT**
🔍 **Key Observations:**
- **Resistance Lines:** The green trendline and resistance at **3.601 USDT** are critical for confirming the bullish momentum.
- **Volume Bars:** Increasing trading volume suggests growing interest and demand.
- **Stop-Loss Zone:** Positioned below **2.301 USDT** for risk management.
- **Profit Zones:** Highlighted in green, pointing to potential rewards for upward movement.
⚡ **Our Analysis:**
If FIL successfully breaks the resistance line and maintains volume, it could aim for higher targets, with the first milestone at **3.601 USDT**. Continuation of the bullish trend could drive prices to subsequent levels.
📢 What's your take on FIL's bullish potential? Share your thoughts below! 🚀

FILUSDT LONG/SHORTBy utilizing Fibonacci retracement levels, historical patterns, , we can formulate a hypothesis that the market might follow a similar trajectory if bullish sentiment prevails.
FILUSDT 1D AnalysisFIL ~ 1D Analysis
#FIL Buy after successfully penetrating this resistant line with a short -term target of at least 10%+ from here.

Filecoin Update: Yes, Bullish Confirmed!I thought I should look into Filecoin and guess what, I already did so 10 days ago. Here is an update.
Two weeks ago we got the bottom candle, 7-April, a hammer at the end of a down-move. A clear reversal signal.
This week is the third week green. Classic textbook confirmation of the hammer reversal. After the signal comes in, two weekly session moving positive will confirm this signal. And that's exactly what we have on the chart.
This week is green but notice the chart. Just look at it. Look at the current action and just how low prices are. The action is happening below the December 2022 low based on candle close. This means that we are still within bottom prices, the best possible entry prices ever; an incredibly opportunity; an amazing buy-zone.
Good news and bad news.
Good news is that prices are still low.
Bad news is that prices won't remain low for much longer, the market will grow soon and once it starts growing there is no second chance. The second chance is now, the first one was the 7-April low.
This is for you. What will you do?
Some pairs are already moving and I hate to buy when prices are higher, I love catching the bottom, it leaves no room for stress. When we buy when the action is happening, there tends to be a stop and as soon as prices drop, we become anxious because we don't know what will happen next.
When we get the bottom, it doesn't matter what happens we are always in the green, in this way, trading becomes fun, profitable and easy. This is an easy win.
» 2,400% potential is strong but still a conservative target. Cryptocurrency is set for something that cannot be described in simple words.
Total growth can amount to 1,000%, or even 500% and still, this would be amazing considering that other opportunities can result in devaluation rather than growth.
The entire market is set to grow on average between 10-30X. If the entire market grows on average between 5-10X, we will take it and be happy and grateful, as long as we win, we can continue to trade.
The market will not grow 5-10X, this is the growth that we experienced in the transition year, it will go much, much higher.
Thanks a lot for your continued support.
Namaste.

FIL RectangleBINANCE:FILUSDT has been trading in a rectangle since August 2022. It recently below the demand zone, swept liquidity to $2 and regained support.
Key Levels to Watch
• $2.4-$3.0: Support and multi-year demand zone, recently tested and regained.
• $10.5-$11.8: Resistance and multi-year supply zone.
Measured Rectangle Targets
• Breakout: $20.0, also a support dating back to December 2020.
• Breakdown: $0.5
Filecoin is still lagging behind other alts, but, if you're looking for something you don't need to chase, it could already offer a nice long entry, with interesting R/R and a clear invalidation (lower low below $2.0).

FIL TO THE MOON The patient is the biggest winner at the end of the journey. The journey is long, not just one day .

Waiting for around 2.40for the time being i expect fil to be bearish.., price may go bullish from 2.40.
Bullish Sign FIL / USDTBreak and retest high and make a new higher low also there is a fake breakout on Weekly
Target : 3
Stop : 2.36

FILUSDT-Analysis-WeeeklyIn the Weekly timeframe FILUSDT reached a powerful reverse point
** No FUTURES **
Target = 7.5$

Short Position FIL/USDT🔥 FIL/USDT – Approaching Key Short Zone
FIL is currently consolidating within a tightening wedge structure, showing signs of bearish indecision as price grapples with a well-defined short zone. Price action has moved aggressively from local lows and is now testing multi-level resistance areas.
🟣 Zone to Watch:
“Possible Short Zone” highlighted in purple — this zone marks a high-probability entry area where sellers could step in.
📍 Entry Point:
🔴 Short Entry: 2.654 – Near the lower end of the resistance window.
📉 Momentum & Setup:
Chart Formation: The consolidation has created a rising/symmetrical wedge, indicative of a bearish retest scenario.
Volume Consideration: Look for a spike in volume accompanying a bearish reversal near the upper band of the zone.
🟢 Take-Profit Zones:
✅ TP1: 2.518
✅ TP2: 2.333
✅ TP3: 2.125
✅ TP4: 1.848 (Final zone)
❌ Invalidation Level: 2.90+
(A strong close above this level would signal a potential trend reversal and invalidate the bearish setup.)
🧠 Narrative:
This setup is a textbook example of a bearish retest where support converts to resistance. The rapid price climb has likely exhausted buyers, setting the stage for sellers to capitalize on the multi-level resistance. Smart money appears poised to offload positions at these levels before further downside expansion, potentially triggering a liquidity grab.
🎲 Market Context:
Keep an eye on overall crypto market sentiment.
📌 Risk Management:
As always, manage your position sizes and money management carefully. Consider setting a stop-loss just above the invalidation level (around 2.90) to protect against unexpected moves.
