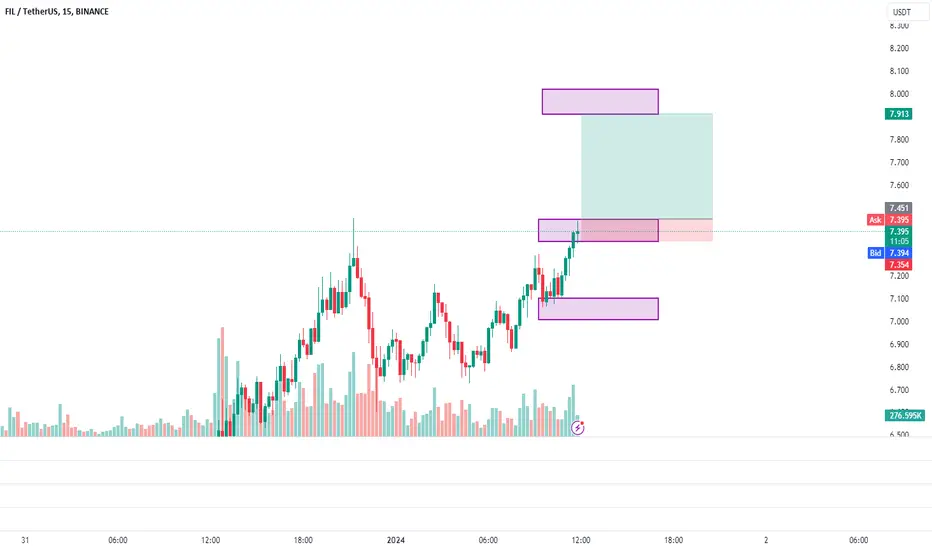
FILUSDT - neutral on 1 hhi traders
FILUSDT has been consolidating on 1h time frame.
2 possible scenarios are shown on the chart
It's a short-term trade so we are expecting an immediate price action at any time .
Enter long or short once the price choose the direction (enter at the breakout)
FILUST trade ideas

FILEUSDTOn-Chain Analysis:
On-chain analysis involves studying blockchain data to gain insights into market trends. For Filecoin, we would look at factors such as transaction volume, active addresses, and token distribution. A significant increase in these metrics could suggest growing interest and adoption, potentially driving the price higher.
Fibonacci Levels:
Fibonacci retracement levels are often used to identify potential support and resistance zones. Traders believe that these levels represent key areas where the price might reverse or consolidate. If Filecoin manages to break through and hold above key Fibonacci resistance levels, it could signal a strong bullish trend.
Mass Adoption:
Global mass adoption of Filecoin would be a game-changer. As more individuals and businesses adopt Filecoin for decentralized storage solutions, the demand for the token could surge. Increased utility often translates to higher token value. Partnerships, collaborations, and integrations with major players in the tech industry could also fuel adoption.
Price Prediction:
Given a bullish scenario where on-chain metrics show sustained growth, Fibonacci levels are breached convincingly, and mass adoption takes hold, a $1000+ Filecoin isn't out of the realm of possibility. However, it's crucial to acknowledge the speculative nature of such predictions, and the cryptocurrency market's inherent volatility.
Risk Factors:
Cryptocurrency markets are highly volatile and influenced by various unpredictable factors. Regulatory developments, technological challenges, or market sentiment shifts can impact prices significantly. It's essential for investors to conduct thorough research and be aware of potential risks

FIL/USDT COULD RISE TO RESISTANCE ZONE AFTER BULLISH BREAKOUT#FIL/USDT
Price could rise to the resistance zone after bullish breakout from symmetrical triangle pattern💁♂️
Watching for potential breakout of this zone to continuation bullish move✈️


FIL Potential to Increase to $15.6 in Q1 2024FIL Potential to Increase to $15.6 in Q1 2024
Please accept our apologies if this is a mistake.
I see FIL coin has the potential to rise to a price of 15.6 dollars for Q1 of 2024 or maybe more than that.
For the reason there is a triangle pattern over a larger period of time and other reasons present in the video. And at this time it has gone out of the daily trend line.

SasanSeifi 💁♂FIL / 3D ⏩ 6.50$ / 7$ As you can see, in the long-term 3-day time frame, the price has been rising from the demand zone to the liquidity zone. Then, after liquidating the buyers, after a partial correction, it was able to rise again from the price zone of 4.20 USD to the price zone of 5.22 USD. It is currently trading at the price zone of 5 USD. In the medium term, there is a possibility of further growth.
A scenario that we can consider is as follows: if the price remains in the price zone of 5/4.70 USD after ranging, it will continue to grow further to the target zones of the liquidity zone of 6.40 and the supply zone of 7/8 USD. In the case of growth, to better understand the continuation of the movement trend, we need to see how the price will react to the supply zone. In addition, if the price penetrates below the price zone of 4.50/4.70 USD and stabilizes, the price may face further correction.
🔵Remember, always conduct your analysis and consider other factors before making any trading decisions. Good luck!"✌️
❎ (DYOR)...⚠️⚜️
Sure, if you have any more questions or need further clarification, feel free to ask. I'm here to help!
if you found my analysis helpful, I would appreciate it if you could show your support by liking and commenting. Thank you!🙌✌

FIL/USDT Breakout Alert! Descending channel. Bullish Momentum !!💎 FIL has notably made its mark in the cryptocurrency market. Recently, FIL achieved a significant milestone by breaking out of a major descending channel pattern, signaling a shift to bullish momentum.
💎 This breakout suggests that FIL might enter a retesting phase, likely at the demand area or along the support trendline of the descending channel, before it can probability continue its ascent toward a strong resistance area.
💎 However, there's a possibility that FIL might approach the resistance area directly without undergoing a retesting phase. In such a scenario, FIL could face rejection at this resistance level, which might lead it back down to the demand area.
💎 The demand area becomes crucial in this context. For FIL to maintain its upward trajectory, it must bounce back from this area. Should FIL fail to hold its ground at the demand zone, particularly if it breaks below it, the asset could potentially drop further to a lower demand area, around the $4.4 mark.

CRYPTO : FILUSDTHM signal (High momentum) spotted. Looking good with previous wave up with increasing volume and momentum.
- Seems to be holding well at current level
- Support at Zone @ 7.259-7.512
It is potentially trending up higher with increase of strength and momentum.

Filecoin's Potential Surge: Prepare for Price Takeoff!BINANCE:FILUSDT is gearing up for a significant surge, backed by 15 months of accumulation reaching the 0.618 Fibonacci level. This aligns seamlessly with a crucial supply zone and a measured move of the triangle pattern, painting a compelling picture for potential growth ahead.

FIL: DECEMBER 31, 2023I believe this is a great long opportunity among the coins on the market. It is considered a laggard as well, and in the short term, I see the potential for a great swing trade. Hope you like the idea. Please share if you find it useful. Thanks!

$FIL- GOOD JOB If you got in on this when i shared the near break out point...
Good one..
TSX:FIL will do a mad run.. It is just starting..

File Coin @ $7.6i went on x fomerly twitter and i saw this one trending
now i must i admit i do hesitate recommending cryptos
--
But this one was too tempting not to participate in the
rally hopefully using this example you will see that the
rocket booster strategy
--
applies to all markets
--
Do you remember it ?
-Step#1
The price has to be above the 50 EMA
-Step#2
The Price has to be above the 200 EMA
-Step#3
The 50 EMA should cross above the 200 EMA
--
remember these steps as they are an introduction
into technical analysis
--
Trade safe and remember to take profits on CAPITALCOM:FILUSD
--
**Disclaimer:**
The information provided above is for educational and informational purposes only.
--
It does not constitute financial advice, and trading always involves
--
a risk of substantial losses, regardless of the margin levels
--
used. Before engaging in any trading activities, it is crucial to
--
conduct thorough research, consider your financial situation,
--
and, if necessary, consult with a qualified financial advisor. Past
--
performance is not indicative of future results, and market
--
conditions can change rapidly. Trading decisions should be made
--
based on careful analysis and consideration of individual
--
circumstances. The user is solely responsible for any decisions made
--
and should be aware of the inherent risks associated with trading in
--
financial markets.

Filecoin FIL Coin Price Prediction🔥 Price on the 4H chart might come at these support area and we might get a potential bounce🔥
Potential bounce areas for Buying 7.108 and 6.251
👉 Follow me for More Real Time Opportunities.
Share your Thoughts if you have any?

FILUSDT # 001 ( opportunity Grow to 15 $ ) Hello dear traders.
Good days .
On Supper Cycle of Gann Square, 1st Gann Square is Growing very weak which is 1st Elliot Wave of supper cycle .
On weekly Gann Square, As is showed , till Mar-2024 it will finish and FILUSDT will test and Hard resistance Gann Fan line which will be on 0.25 Gann Box Fib level .
Chart updated and route plotted with help of Gann Square and Gann Box.
Good luck and safe trades.
Thanks for your support and comments

time to go upi have illustrate all the info you need ... this is just my own opinion and there is not a trading advice .... do whatever you want to do on your own risk ... by the way ... crypto market is always has a consecutive runways ... so don't try to be exact on it .
📊#FIL may continue to rise based on the double bottom structure➡️After a long decline, we constructed a smiling face bullish structure and a small double bottom structure at the bottom, and used this as support to start rising. When we reached the mid-term TP zone, we started a sharp correction, which was very reasonable. Because the realization of macro-cycle goals is often accompanied by macro-cycle adjustments. When we pulled back to fib0.5, we re-established a double bottom long structure, so I have reason to think that we will continue to rise next.📈
🧠If we can successfully break through the short defense point above, then there is a high probability that we will challenge the previous high. If the previous high is broken, then a higher target is worth looking forward to. So it's important to be patient.☕️
⚠️But to be conservative, we will first lock in about 50% of the profit. If we do not continue to break through the short defense point above, our position is not heavy, so the corresponding risk is also reduced. If we continue to break through the short defense point above, but do not continue to break through the previous high, and then start to pull back, we will look for opportunities to add to the position.⚙️
🍻I have helped everyone make money, so I hope you can also help me. Please remember to like❤️share my analysis posts and channels. 📤
💕 Follow me so you don't miss out on any signals and analyze 💯

FIL/USDT BUY NOW!!! 10.2 INCOMING!!!!!!!!!FIL just took out the buyside liquidity and price is ranging above the FVG zone am expecting another breakout structure from current resistance of 7.5 then price should maintain uptrend stability till 10.2 target is completed

Filcoin,, my Target FileCoin can still grow after crossing the previous ceiling, and the price will go up.

[FILUSDT] - unstoppable bullish 🔥🔸Weekly chart looks cheerful
🔸Weekly close directly below the major trend..... doesn't happen before
🔸Double bottom consolidated .
🔸Need to confirm breaking out the down trend to reach my target (50$)
Dont forget to support us with ur like,comment and follow for more ideas.🎯

Bullish on $FilInstead of chasing alt that already gone up 300%, pick those that are building momentum. Fil is one of them, obv coming in nicely, I am bullish as long as it stay above the support line. First major target $10.


FILL ENTERING NEW UPTREND VOLUMEThank you for reading this update.
Depending on our study we see that FILL has a good chance of volume increase.
This updates depending on day trade, And the market should confirm with time the right market way.
#Nottradingadvice
#For Day traders take always profits when the market increase
#Expect nothing from the markets, but follow what it shows.

FILUSDT Long/Short Just an IDEA !!!FILUSDT is at perfect buy zone n testing the resistance as of now, a breakout with good volume can pull FIL till 26$, this bull cycle it can pinup till 180$, NEVER MISS FILL...
NAFA n DYOR
ThankYou....
