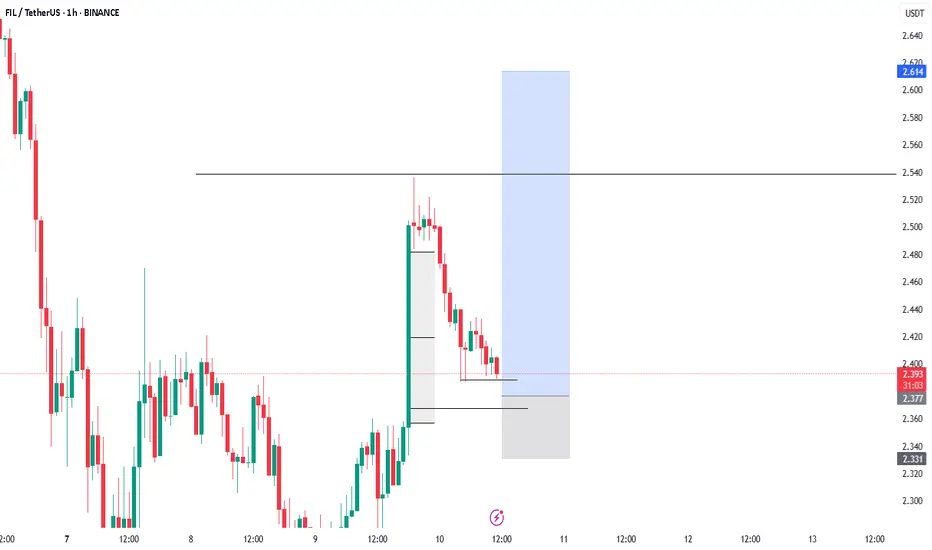
Filusdt long I just now entered Filusdt
Time sensitive.
Scalp to $2.473 might adjust target based on momentum
FILUST trade ideas

FIL can touch 1$ in the coming weeksFIL / USDT
The price just brokedown the Huge trading range (2022-2025) on weekly chart and price still find difficulty to restore the broken support
Our view for this coin in mid term is bearish and few weeks we can see FIL hits 1$ 📉
This is my macro view for FILUSD as long as price doesn’t reclaim the support with strong volume
Best of wishes

#FILUSDT remains under bearish pressure📉 SHORT BYBIT:FILUSDT.P from $2.616
🛡 Stop loss $2.645
🕒 1H Timeframe
⚡️ Overview:
➡️ The POC (Point of Control) BYBIT:FILUSDT.P is located at $2.766, far above the current price — this highlights strong historical selling pressure.
➡️ Price is forming lower highs and lower lows, confirming a bearish trend.
➡️ The breakdown below $2.616 triggered the short setup with further downside potential.
➡️ Volume spikes during red candles indicate continued seller activity.
🎯 TP Targets:
💎 TP 1: $2.605
💎 TP 2: $2.584
💎 TP 3: $2.570
📢 Watch the $2.616 zone — holding below increases downside probability.
📢 If price moves above $2.645, the setup becomes invalid.
BYBIT:FILUSDT.P remains under bearish pressure — short bias stays valid under current structure.

FIL Secondary trend. Channel zone. 31 03 2025Logarithm. Time frame 3 days (less is not needed).
Main trend. Time frame 1 week.
Published more than 2 years ago 22 01 2023
FIL/USD Main trend. From the maximum of $237 -99%
In the specified range, a horizontal channel with a large % step (exactly 370%) was formed earlier (2.590 - 7.157/10.7). There have already been 3 pumping waves in this channel. From the pumping highs in the main trend, the price fell by -98.98%
Secondary trend . This horizontal channel with a step of 370% and work with trend reversal formations.
Local trend , zone of formation of a descending wedge, zone of capitulation and trend reversal.
FIL/USDT Local trend. Wedge. Price clamping . 30 06 2024
Working now with the forming descending wedge and trend reversal in case of its breakthrough.

Filecoin bullish scenarioFilecoin price has reacted many times at this support level.
Easy invalidation here. Lose support, trade is invalidated.

Filecoin FIL Will Continue Bear MarketHello, Skyrexians!
Recently we made the most hated article about Bitcoin Dominance growth, but this chart reflects great what can happen soon. The mistake of the most traders here is that they are sure that alseason will come now. Most of crypto shows weakness and we need to be more realistic. Today we take a look at BINANCE:FILUSDT as an example of bear market continuation for risky assets!
Let's take a look at the weekly chart. Current bear market can be seen as an ABC. The most common mistake that people think that wave B is an accumulation, but this is redistribution and the new mark down phase is starting now. The support will be broken because there is no other way. There was a chance for altcoin season in November when price has formed the anticipated wave 1, but wave 2 has broken this belief and now we are in the wave C. Current wave is wave 3, but to the downside. Targets are very low, they cannot be measured, but FIL may easily touch $1. This bear market will be finished with the ending diagonal, like most of major trends. This information is not for panic, but be ready for the big crash again. Anyway, now there is a great price for long term accumulation, the only one question will you be able to see -70% from the current portfolio value?
Best regards,
Skyrexio Team
___________________________________________________________
Please, boost this article and subscribe our page if you like analysis!

Filecoin Technical Analyze Trend: The price shows a strong decline after a massive spike, which indicates it could be experiencing a retracement or consolidation phase.
Support: Around the 2.50–2.80 level (green zone), which seems to have held during recent price movements.
Resistance: The red zone around 5.00–5.50 is the immediate resistance, with higher resistance near 59.48, which indicates significant selling pressure above this level.
Volume: There is a noticeable surge in volume during the price decline, suggesting that the recent downtrend is likely being fueled by significant selling activity. This could indicate a potential continuation if the volume stays elevated.
Price Action: If the price tests the 2.50–2.80 support zone and holds, we might see a rebound. Otherwise, a breakdown could target 0.45.

this is a golden time to buy FILUSDT(136% Profit)Golden Signal :
Buy in this zone about 3.200
Sell Zone For Step 1 and Take Your profit 50% Is First Red Box ,4.333 USDT (34% Profit)
Sell Zone For Step 1 and Take Your profit 50% Is Secound Red Box, 7.578 USDT(136% Profit)
Enjoy
:)

Fil will increase againSince we have divergence at the support zone, it looks like the price might bounce back a little

Breaking: Filecoin Reclaims $3 Surging 4.80% Today The price of Filecoin ( LSE:FIL ) saw a noteworthy uptick in price surging 4.80% today, breaking key resistance albeit the crypto market in a bullish trend. LSE:FIL is enroute the $4 mark.
The decentralized storage system that aims to “store humanity’s most important information has been constrained in a consolidation zone for almost 2 months without a clear cut direction, sticked in the $2.70 price zone.
Should Filecoin breakthrough the $3.3 pivot point and possibly the 1month high that is serving as the the resistant point ($3.5), LSE:FIL could secure a move to the $4 zone and consequently a breakout to $7-10.
Filecoin Price Live Data
The live Filecoin price today is $3.12 USD with a 24-hour trading volume of $131,402,802 USD. Filecoin is up 3.50% in the last 24 hours, with a live market cap of $2,016,455,965 USD. It has a circulating supply of 645,941,959 FIL coins and the max. supply is not available.

FILUSDT 1WThe price has reached three strong and valid support levels:
1. Static support zone
2. Lower boundary of the descending channel
3. Mid-band support of the pitchfork
It seems that if any correction occurs, it will likely be more of a time correction rather than a significant price drop. I don’t anticipate any major decline for this asset.

FIL: The Life-Changing Setup You Can’t Ignore!FIL has been in a massive 3-year accumulation, just like LINK before its explosive run. The setup is textbook perfect—and the window to get in won’t stay open forever.
Right now, FIL is at historical lows, setting up for a potential 600%+ move. If you're sleeping on this, you might be making a huge mistake. Don’t be that kind of stupid.
Entry: NOW
TP: 19
SL: 1.8

FIL/USDT Breakdown – Is a Major Drop Coming? Yello, Paradisers! FIL/USDT has just broken below the EMA 50, and that’s a big red flag for bulls. This level had been acting as strong dynamic support, and now that it’s lost, the bearish momentum is strengthening. If buyers can’t reclaim it soon, the market could be gearing up for a deeper move to the downside.
💎The price is struggling around the major Supply Zone at $2.90 - $3.00, and the failure to hold above this level combined with the EMA 50 breakdown increases the likelihood of a drop toward the next Support Area at $2.467 - $2.209. With the EMA 50 now acting as resistance, any retest is likely to face heavy selling pressure.
💎The EMA 200 remains a key dynamic resistance, reinforcing the bearish bias. Unless FIL/USDT reclaims the EMA 50 and breaks convincingly above $3.306 with strong volume, the downward trend remains intact.
💎If the decline continues with increasing volume, sellers are firmly in control, making a deeper drop more likely. On the other hand, a weak move lower with low volume could indicate exhaustion, potentially leading to a short-term bounce or consolidation.
This is not the time to chase trades blindly. Patience and discipline always win in the long run, Paradisers. Stick to your levels and execute only high-probability setups. Stay sharp.
MyCryptoParadise
iFeel the success🌴

FILUSDT - Buy now or regret later!FIL is literally one of the hidden gems in the market.
The probability of a strong rebound is increasing significantly in the coming days. The coin has reached its strongest support level, a key historical reversal point.
Investing in it now is a golden opportunity, with a target of $27.
The bottoms have already formed across many altcoins—now is the best time to buy
Best regards Ceciliones🎯

Filecoin (FIL): Looking For Re-Test of Broken SupportFilecoin has the potential to move to upper zones after we caught that good drop.
We see that the support zone was broken with a clean drop but sellers did not have a chance to secure this zone so here we are looking for a proper re-test of that zone where we might get another rejection!
Swallow Team

TradeCityPro | FILUSDT Continuing the Analysis of U.S. Coins👋 Welcome to TradeCityPro Channel!
Let’s analyze another coin with a U.S. base, which has the potential to be listed in ETFs in the future, as the U.S. currently has the most influence on the market!
🌐 Overview Bitcoin
Before starting the analysis, I want to remind you again that we moved the Bitcoin analysis section from the analysis section to a separate analysis at your request, so that we can discuss the status of Bitcoin in more detail every day and analyze its charts and dominances together.
This is the general analysis of Bitcoin dominance, which we promised you in the analysis to analyze separately and analyze it for you in longer time frames.
📊 Weekly Timeframe
We are still within the weekly box, and the coin’s situation is not very favorable, as it is currently fluctuating around its most important support level.
After failing to reach the top of the weekly box and facing an early rejection, the market has experienced a decline in recent price corrections. Currently, the price is fluctuating around 3.139, which is the most crucial support level at the moment.
From a price perspective, this is a good buying zone, but since the market is highly bearish, I personally wouldn't buy without confirmation. I'd prefer to let the price range a bit and form a structure, or wait for a strong green candle. Otherwise, my buy trigger would be a breakout above 9.899.
📈 Daily Timeframe
The main trend is still bearish, meaning we continue forming lower highs and lower lows. Currently, the price is ranging between 2.995 and 3.753.
After a rejection from 8.051, the price formed a support level at 4.836. However, after breaking this support and retesting it (which has now turned into resistance), the price engulfed the previous three candles, leading to a drop to 2.995.
If the price breaks above 3.573, the Fibonacci levels that we have drawn will act as strong resistance zones for further upward movement. The most important of these levels is 4.836, which previously caused a significant rejection.
For buying, the more the price ranges within the 2.995 - 3.573 box, the stronger the 3.573 breakout trigger will be. For selling, I recommend exiting below 2.995. If the price moves back above 3.573, you can reinvest with the same USDT amount, but in a smaller quantity of FIL, to manage your risk.
📝 Final Thoughts
Stay calm, trade wisely, and let's capture the market's best opportunities!
This analysis reflects our opinions and is not financial advice.
Share your thoughts in the comments, and don’t forget to share this analysis with your friends!

FILUSDT at a very discounted Price. FILUSDT is in Accumulation Zone
Will be a good buying option with
Discounted Price
Entry Made at 3.1 with SL 2.4 and TP 7
A good Gain with least lost

FIL BUYHI friends
According to the pullback we had, we can enter into the transaction with risk and capital management.
*Trade safely with us*

exit of boxMany are looking for a head and shoulders pattern for a decline, but I ask you, isn't a decline enough? I prefer a decline in the uptrend.

FILUSDThi friends.
it is risky... but i will start a new position in these hours...
i used the ichimuko & order blocj strategies for this TA
note that it is risky & you must analyse it yourself
best regards!

FILUSDTHi friends
i used Ichimuko & order block to make this TA
Enjoy it
you can use bigger SL for longterm Position... 3.3 is good

FILECOIN, Will we see 4$ again ?Hello Traders, Hope you are doing great.
After a downward movement that happened yesterday, now price is trying to find support around this level, so for upcoming days I expect an upward correction to specified blue Dashed lines.
Don't forget to use proper risk management .
Tell me What are your thoughts about FILECOIN ? UP or DOWN ? comment your opinion below this post.
