FIO Protocol (FIO)On the above 3-day chart price action has corrected over 90% since the sell signal April 2021 (not shown) at 50 cents. Today is great long opportunity. Why?
1) You know why.
2) RSI and price action resistance breakout.
3) Strong bullish divergence. Multiple oscillators print positive divergence with price action over an extended period.
Is it possible price action falls further? Sure.
Is it probable? No.
Ww
Type: trade
Risk: <=6% of portfolio
Timeframe: Don’t know.
Return: Will say elsewhere
FIOUSDT trade ideas
FIO / cup and handleHi
On the daily frame, we see a cup and handle, the breakout occurred and then it was retested .
The model is ready, it needs liquidity.
The Target of a cup and handle is 0.052
But in chart all the targets
Stop loss close day candle below 0.039
SL 0.039 1D
Attention: This currency is slow moving, it requires patience as well

FIO Jinng Gann FANZ/LevelsJinny Gann Fan Levels are on the Chart possible Trendlines my WAY.
Jinny Gann Fan/Horizontal Lines Works as Support / Resistance.
Important levels for the Big 2 Cycles on the chart.
Trade Wisely.
Wish You Best of LUCK.

FIOUSDTThe cup and handle chart pattern is a bullish continuation pattern in technical analysis. It consists of a cup-shaped formation followed by a smaller, downward-sloping handle. The breakout above the resistance level of the cup signals a potential uptrend continuation. It indicates a shift from consolidation to renewed buying interest.
Short term target upon completion of Cup is at 0.04250
Rejection can be seen for the formation of its handle or it might break the neck line depending upon volumes.
Mid term target after the breakout of the neck line is at 0.05259

FIOUSDT- BullishFIOUSDT is in accumulation phase. Breakout of this phase will strength bullish sentiments.

FIO Good opportunityI see a good opportunity to buy some FIO. Price is moving on daily and hourly support, and it's also trying to bounce from main trendline. If the price will reclaim and break the resistance on H1 timeframe (0.0256) we can see a decent pump.

FIOUSDT(FIO Protocol) Daily tf Range Updated till 26-01-24FIOUSDT(FIO Protocol) Daily timeframe range. 0.02355 - 0.02921 range level still intact. if it cant break 0.02355 it will try again at 0.02921. depends on volume whether it can cross it or not.

FIOUSDT"As we enter the bullish season, the initial target to aim for is
target : 0.3 🎯.
This is based on a combination of technical analysis indicators and market trends.
However, it's important to approach trading with caution and adapt to changing market
conditions.
Keep an eye on key support and resistance levels, as well as any significant news or events that may impact the market.
Remember to use proper risk management techniques and consider setting profit targets along the way.
Happy trading!"

✴️ FIO Protocol Ending Diagonal (333% Growth Potential)This pattern here, the ending diagonal, signals the end of a move/trend, in this case the bearish trend.
FIO Protocol (FIOUSDT) bottom mid-September, which goes in accordance with many other Altcoins. Many pairs chose this same date to start their reversal.
We can see a bullish bias now based on the strong RSI reading and the high volume 3-July before the September lower low came in.
The fact that we have three months of slow and steady growth as the action moves past EMA10, is also a good indication.
The rest is easy... The market force will push prices up.
Namaste.


FIO / USDT Got Some PotentialFIO in the process of the rebound near support range.
Long-term view live chart is below:

FIOUSDTFIOUSDT is in bearish trend.
Potentially printing LH and LL.
No sign of reversal from here.
We wait and watch for the breakout of last LL.

🚀 Fiousdt 🚀🚀💰🧠💡📈🪙 "Entered Fiousdt Coin using the Smart Money Concept Theory! Let's ride this rocket to the moon! 🌕🚀🤑 #SmartMoney #FiouastCoin #CryptoGains" 🪙📈💸🌌

FIO might follow FRONTHello Traders,
As you can see, everything is visible on the chart. Front started wallet season. So, FIO can follow it.
Please hit the boost button and follow me for more ideas.
Thanks

FIOUSDTA good support around 0.018, may push the prices for testing 0.030 and the violation for it will targeting 0.078 / 0.08


FIO Protocol (FIO) vs USD/BTCOn the above 1-day chart we have a 82% correction from the highs of August with following oversold condition (orange column). MFI is in divergence with price action for over a period of 30 days now.
Is it possible price action falls further? Sure.
Is it probable? Unlikely. Price action is considerably oversold with regular bullish divergence.
1st target is 92% / $0.14 from current levels.
1-day BTC chart showing bullish divergence

✴️ FIO Massive Jump With More To Come (97% Potential Or More) Here is another Altcoin pair that isn't shying away to grow on a weekend... FIOUSDT.
After moving above its June 2022 low/support, FIOUSDT produced the highest buy volume since the above date, this is happening within short/mid-term higher lows.
The correction of the initial bullish wave also ended before mid-March, in this case the 10th...
We can see this same pattern all across:
1) Bullish breakout early 2023.
2) Correction late February/early March.
3) Resumption of bullish trend (now).
The pairs that are moving ahead reveals what will happen to those that are yet to move.
I am mapping here a 97% price jump but there can be more.
These Altcoins can take their time because they are set to produce long-term higher highs and higher lows.
Namaste.

FIO/USDT looking good on chartWill be waiting for good rise on FIO/USDT overall a down on BTC till 24K-23K will be good for alts if it holds that price. Otherways if down on BTC won't happen, then this chart is active on short term.
Not financial advice. DYOR.

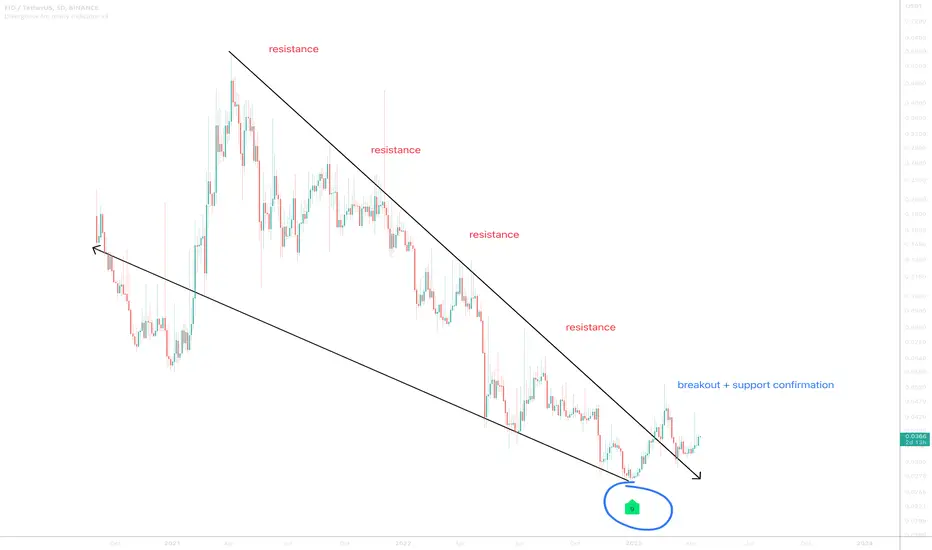
$FIO/#USDT [#FIO Protocol]: Resistance_Breakout◳◱ A Resistance Breakout has been identified on the $FIO / $USDT chart. The price has broken above a key resistance level, indicating a potential bullish trend. The next resistance key levels are located at 0.0364 | 0.0403 | 0.0478, and the major support zones can be found at 0.0289 | 0.0253 | 0.0178. Consider entering at the current price zone of 0.0319 and targeting higher levels.
◰◲ General info :
▣ Name: FIO Protocol
▣ Rank: 487
▣ Exchanges: Binance, Huobipro, Gateio, Mexc
▣ Category/Sector: Payments - Interoperability
▣ Overview: The FIO Protocol is a Layer 1 blockchain built as a usability solution for the entire blockchain ecosystem. It sits beside and works with all other blockchains to securely facilitate workflow, confirmation, and other data between any and all blockchain/crypto user applications in a decentralized and self sovereign manner.
FIO Protocol augments blockchain interactions to enable usability features like human-readable wallet names (e.g. jane@smith), decentralized payment requests (e.g. for invoicing, order carts, etc.), cross-chain metadata (e.g. to note invoice ID, order #, etc.), and NFT forgery prevention. It can be integrated into any wallet, exchange, payment processor, NFT marketplace, or staking platform.
◰◲ Technical Metrics :
▣ Mrkt Price: 0.0319 ₮
▣ 24HVol: 275,994.603 ₮
▣ 24H Chng: 5.281%
▣ 7-Days Chng: -11.65%
▣ 1-Month Chng: -12.63%
▣ 3-Months Chng: -3.02%
◲◰ Pivot Points - Levels :
◥ Resistance: 0.0364 | 0.0403 | 0.0478
◢ Support: 0.0289 | 0.0253 | 0.0178
◱◳ Indicators recommendation :
▣ Oscillators: NEUTRAL
▣ Moving Averages: BUY
◰◲ Technical Indicators Summary : BUY
◲◰ Sharpe Ratios :
▣ Last 30D: -2.51
▣ Last 90D: -0.37
▣ Last 1-Y: -0.69
▣ Last 3-Y: 0.43
◲◰ Volatility :
▣ Last 30D: 0.83
▣ Last 90D: 0.75
▣ Last 1-Y: 0.93
▣ Last 3-Y: 1.46
◳◰ Market Sentiment Index :
▣ News sentiment score is N/A
▣ Twitter sentiment score is 0.58 - Bullish
▣ Reddit sentiment score is 0.73 - Bullish
▣ In-depth FIOUSDT technical analysis on Tradingview TA page
▣ What do you think of this analysis? Share your insights and let's discuss in the comments below. Your like, follow and support would be greatly appreciated!
◲ Disclaimer
Please note that the information and publications provided are for informational purposes only and should not be construed as financial, investment, trading, or any other type of advice or recommendation. We encourage you to conduct your own research and consult with a qualified professional before making any financial decisions. The use of the information provided is solely at your own risk.
▣ Welcome to the home of charting big: TradingView
Benefit from a ton of financial analysis features, instruments and data. Have a look around, and if you do choose to go with an upgraded plan, you'll get up to $30.
Discover it here - affiliate link -

$FIO/#USDT [#FIO Protocol]: Resistance_Breakout_Confirmation◳◱ We've detected a Resistance Breakout and Confirmation on the $FIO / $USDT chart. The price has broken above a key resistance level and has been confirmed by a strong candle, indicating a potential bullish trend. The next resistance key levels are at 0.0472 | 0.0536 | 0.0678 and the major support zones are respectively at 0.033 | 0.0252 | 0.011. We may consider entering a trade at the current price zone at 0.0453 and targetting higher levels.
◰◲ Technical Metrics :
▣ Mrkt Price: 0.0453 ₮
▣ 24HVol: 1,388,249.465 ₮
▣ 24hChng: 7.092%
◲◰ Pivot Points - Levels :
◥ Resistance: 0.0472 | 0.0536 | 0.0678
◢ Support: 0.033 | 0.0252 | 0.011
◱◳ Indicators recommendation :
▣ Oscillators: BUY
▣ Moving Averages: STRONG_BUY
◰◲ Technical Indicators Summary : STRONG_BUY
◳◰ Market Sentiment Index :
▣ News sentiment score is N/A
▣ Twitter sentiment score is 0.56 - Bullish
▣ Reddit sentiment score is 0.73 - Bullish
▣ In-depth FIOUSDT technical analysis on Tradingview TA page
▣ What do you think of this analysis? Share your insights and let's discuss in the comments below. Your like, follow and support would be greatly appreciated!
◲ Disclaimer
Please note that the information and publications provided are for informational purposes only and should not be construed as financial, investment, trading, or any other type of advice or recommendation. We encourage you to conduct your own research and consult with a qualified professional before making any financial decisions. The use of the information provided is solely at your own risk.
▣ Welcome to the home of charting big: TradingView
Benefit from a ton of financial analysis features, instruments and data. Have a look around, and if you do choose to go with an upgraded plan, you'll get up to $30.
Discover it here - affiliate link -

FIO CAN PUMP
Hi, dear traders. how are you ? Today we have a viewpoint to BUY/LONG the FIO symbol.
For risk management, please don't forget stop loss and capital management
When we reach the first target, save some profit and then change the stop to entry
Comment if you have any questions
Thank You

