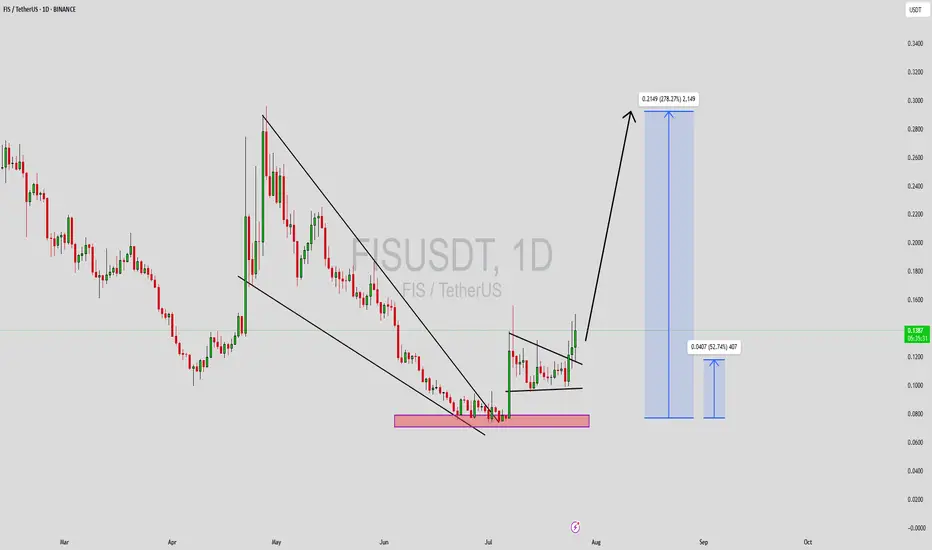
FISUSDT Forming Falling WedgeFISUSDT is forming a textbook falling wedge pattern on the daily timeframe, a well-known bullish reversal signal that often precedes explosive upside breakouts. After an extended corrective phase marked by declining price and compressed volatility, the asset appears to be nearing a breakout zone. Th
Related pairs
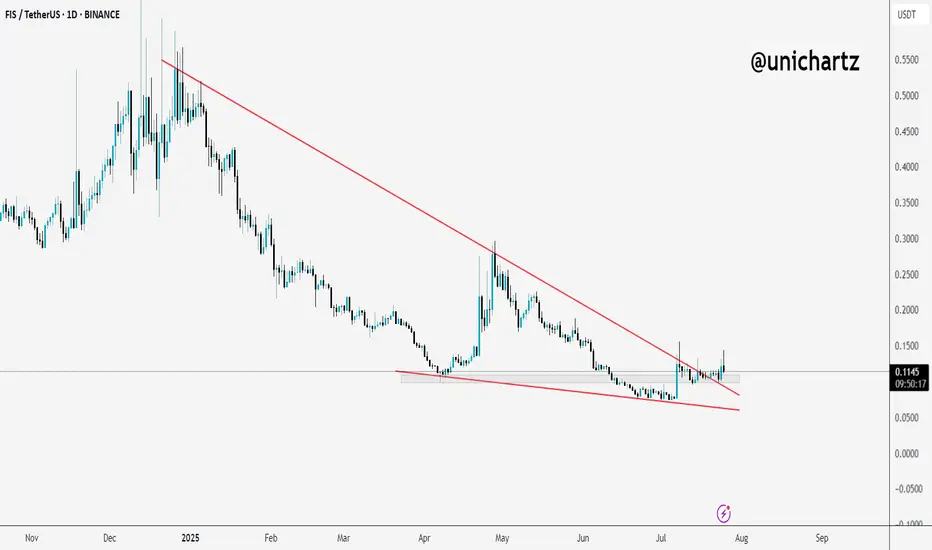
FIS Breaks Out of Falling Wedge – Reversal in Play?$FIS/USDT has finally broken out of a long-term falling wedge pattern, a structure that often signals reversal.
Price is now holding above the breakout zone, showing signs of strength.
As long as it stays above the wedge, we might see further upside in the coming days.
DYOR, NFA
FISUSDT Forming Bullish WaveFISUSDT is currently showing an interesting bullish setup, capturing the attention of crypto traders who are watching for fresh altcoin opportunities. The formation of a bullish wave pattern, supported by steady volume, suggests that FIS could be primed for a strong breakout in the near term. Techni

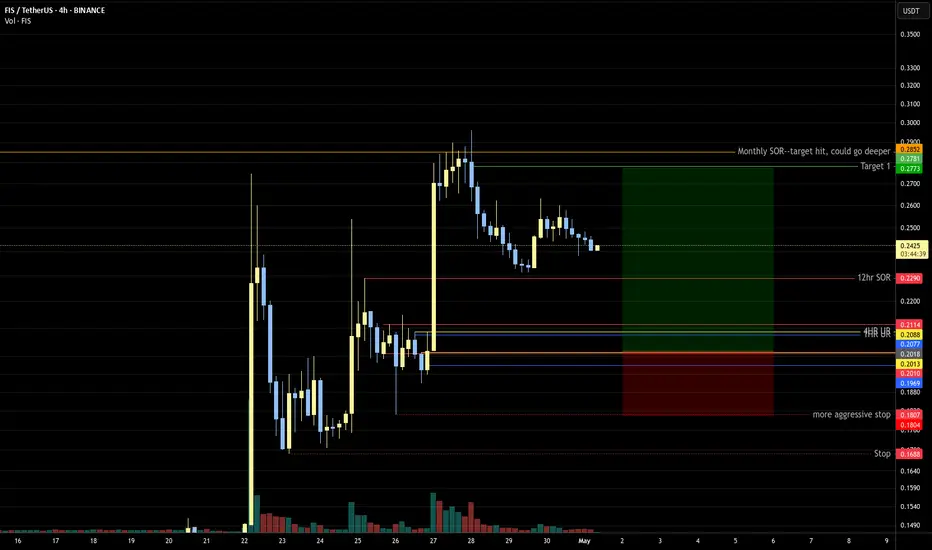
FIS/USDT – Long-Term Outlook (4H Chart)FIS has broken out of a steep downtrend with a strong bullish candle and sharp RSI spike, showing early signs of a potential long-term trend reversal.
Key Observations:
Downtrend resistance broken with volume
RSI exploded above 80, showing strong momentum
Price is currently retracing to the break

FISUSDT Forming Bullish WaveFISUSDT is currently presenting an exciting opportunity for traders and investors who are tracking projects with strong breakout potential. The chart is showcasing a clear bullish wave pattern, a formation that often indicates an upcoming strong upward trend. This setup suggests that FIS could be ge

FISUSDT UPDATE
Pattern: Falling Wedge Breakout
Current Price: \$0.0811
Target Price: \$0.1416
Target % Gain: 75.47%
Technical Analysis: FIS has broken out of a falling wedge pattern on the 12H chart, with a strong bullish candle and increasing volume indicating a potential trend reversal. A breakout confirmation

FISUSDT Forming Falling WedgeFISUSDT is currently displaying a classic falling wedge pattern, which is widely regarded as one of the most reliable bullish reversal signals in technical analysis. This pattern suggests that sellers are gradually losing their grip, while buying pressure is steadily building up inside this narrowin

$FIS Falling Wedge Reversal Setup:
FIS is trading inside a falling wedge — a bullish reversal pattern. Current price action near the lower trendline indicates potential for a breakout to the upside.
🔸 Upside Target: 0.2500 – 0.3000
If the price breaks above the wedge (~0.1650), a move toward 0.20 and higher targets is likely, with

Chart speaks itself, huge reversal coming $FISChart speaks itself, huge reversal coming NYSE:FIS 📈⏳
let's send it higher 🤝

3.5 RREntry is a good risk:reward balance. Possible price hits target before fill, in that case, cancel the order!
See all ideas
Summarizing what the indicators are suggesting.
Oscillators
Neutral
SellBuy
Strong sellStrong buy
Strong sellSellNeutralBuyStrong buy
Oscillators
Neutral
SellBuy
Strong sellStrong buy
Strong sellSellNeutralBuyStrong buy
Summary
Neutral
SellBuy
Strong sellStrong buy
Strong sellSellNeutralBuyStrong buy
Summary
Neutral
SellBuy
Strong sellStrong buy
Strong sellSellNeutralBuyStrong buy
Summary
Neutral
SellBuy
Strong sellStrong buy
Strong sellSellNeutralBuyStrong buy
Moving Averages
Neutral
SellBuy
Strong sellStrong buy
Strong sellSellNeutralBuyStrong buy
Moving Averages
Neutral
SellBuy
Strong sellStrong buy
Strong sellSellNeutralBuyStrong buy
Displays a symbol's price movements over previous years to identify recurring trends.
Frequently Asked Questions
The current price of FIS / TetherUS (FIS) is 0.1238 USDT — it has risen 3.27% in the past 24 hours. Try placing this info into the context by checking out what coins are also gaining and losing at the moment and seeing FIS price chart.
FIS / TetherUS price has fallen by −1.32% over the last week, its month performance shows a 56.66% increase, and as for the last year, FIS / TetherUS has decreased by −63.35%. See more dynamics on FIS price chart.
Keep track of coins' changes with our Crypto Coins Heatmap.
Keep track of coins' changes with our Crypto Coins Heatmap.
FIS / TetherUS (FIS) reached its highest price on Mar 19, 2021 — it amounted to 4.8800 USDT. Find more insights on the FIS price chart.
See the list of crypto gainers and choose what best fits your strategy.
See the list of crypto gainers and choose what best fits your strategy.
FIS / TetherUS (FIS) reached the lowest price of 0.0738 USDT on Jul 1, 2025. View more FIS / TetherUS dynamics on the price chart.
See the list of crypto losers to find unexpected opportunities.
See the list of crypto losers to find unexpected opportunities.
The safest choice when buying FIS is to go to a well-known crypto exchange. Some of the popular names are Binance, Coinbase, Kraken. But you'll have to find a reliable broker and create an account first. You can trade FIS right from TradingView charts — just choose a broker and connect to your account.
Crypto markets are famous for their volatility, so one should study all the available stats before adding crypto assets to their portfolio. Very often it's technical analysis that comes in handy. We prepared technical ratings for FIS / TetherUS (FIS): today its technical analysis shows the neutral signal, and according to the 1 week rating FIS shows the sell signal. And you'd better dig deeper and study 1 month rating too — it's sell. Find inspiration in FIS / TetherUS trading ideas and keep track of what's moving crypto markets with our crypto news feed.
FIS / TetherUS (FIS) is just as reliable as any other crypto asset — this corner of the world market is highly volatile. Today, for instance, FIS / TetherUS is estimated as 10.54% volatile. The only thing it means is that you must prepare and examine all available information before making a decision. And if you're not sure about FIS / TetherUS, you can find more inspiration in our curated watchlists.
You can discuss FIS / TetherUS (FIS) with other users in our public chats, Minds or in the comments to Ideas.