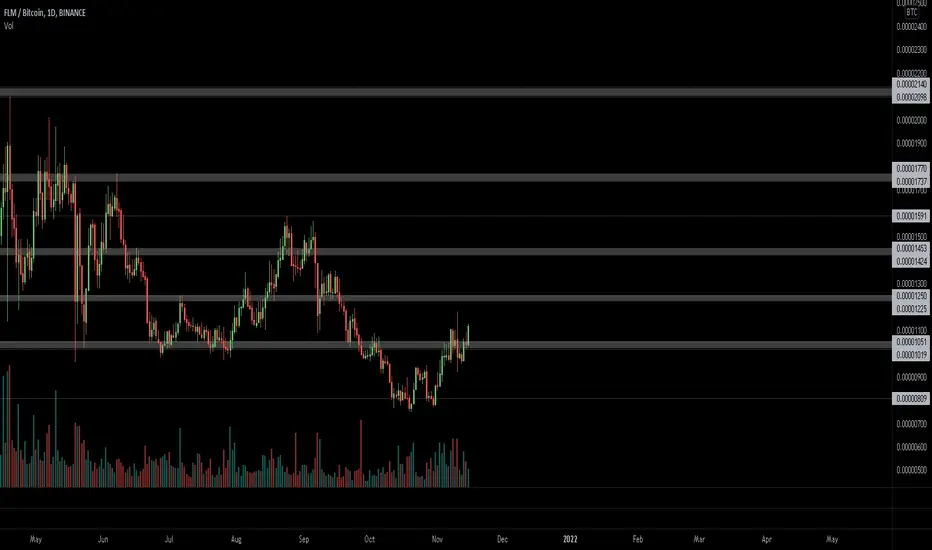
Flamingo | 90 Days Green (300% Or 800%?)Three bullish waves since 2021 and all lasted 90 days (3 months).
Let's keep it simple.
These wave latest between 80-100 days counting from the last low before the start of the wave.
Flamingo (FLMBTC) just hit a major low early August.
If we count 90 days, this would put us in November, early November.
Since there are some variations, it can be late October or mid-November or...
It doesn't matter, if it is going green it is wise to get in now, at the bottom, and sell later on at the top.
This time it can be different though. The initial bullish wave could be the start of long-term growth or it could be the same. What is certain is that a major low has been hit and this pair, FLMBTC, is preparing for a bullish wave.
Use this information in the best way you can.
This is not financial advice.
Namaste.
FLMBTC trade ideas

Flamingo Ultra-Bullish Bottom Setup Can Lead To 955%+Even if by a wick only, we have a long-term higher low on the Flamingo (FLMBTC) chart and we are ready for a massive, early 2024 bullish wave.
I like this chart because even while being conservative the potential goes to 690% —955% can be achieved easily within 3-6 months; more or less.
And they are moving, already moving; some of the classic Alts are already moving.
➖ Notice how Siacoin did the whole turn on the weekly timeframe (SCUSDT).
➖ Notice how AGIXBTC is growing strong within days, not even weeks.
➖ Notice that DGB (both USDT & BTC pairs) is set to move next....
Just two examples of course —and one opportunity— but we have hundreds and hundreds of Altcoins breaking up.
Just as expected; the small and medium sized Altcoins will grow while the big ones retrace.
Thanks a lot for your support.
Namaste.

FLMBTC Next Bullish Signals💎A few weeks ago, #FLMBTC accomplished a significant feat by closing above a critical supply zone on the weekly chart, hinting at the possibility of a bullish reversal. However, it's crucial to exercise caution and seek further confirmations to enhance the probability of this outlook. Specifically, the MCP team is closely monitoring the current demand area. Should this area hold, it could pave the way for an upward surge, breaking through several pivotal resistance indicators. These key resistance points include the 50 Simple Moving Average (SMA), the downtrend trendline, and the Volume Profile resistance.
💎A notable observation is that all these resistance indicators have acted as formidable barriers during potential upward rallies. Therefore, the next significant bullish signal would be the breach of both the 50 SMA and the downtrend trendline. Subsequently, surmounting the Volume Profile resistance at 544 Satoshis would be a decisive turning point, potentially ushering in a long-term bullish trend. In such a scenario, we anticipate #FLM to embark on a journey towards the double Fibonacci resistance level around the 900 Satoshis area, signifying a remarkable 200% increase against #Bitcoin.
💎However, it's imperative to maintain a watchful eye on the current demand area, particularly on the weekly timeframe. If the weekly closing price dips below the critical level of 308 Satoshis, it would raise concerns of a prolonged downtrend or an extended consolidation phase.

$FLM/#BTC [#Flamingo]: Resistance_Breakout◳◱ Hey traders, we've identified a Resistance Breakout on the $FLM / $BTC chart. The price has broken above a key resistance level, which can indicate a potential bullish trend. Taking in consideration the next resistance key levels are at 0.0000052 | 0.0000055 | 0.00000626 and the major support zones are respectively at 0.00000444 | 0.00000398 | 0.00000322. It is a bullish indication and we may consider entering at the current price zone at 0.00000543 and targetting higher levels.
◰◲ Technical Metrics :
▣ Mrkt Price: 0.00000543 ₿
▣ 24HVol: 52.979 ₿
▣ 24hChng: 12.422%
◲◰ Pivot Points - Levels :
◥ Resistance: 0.0000052 | 0.0000055 | 0.00000626
◢ Support: 0.00000444 | 0.00000398 | 0.00000322
◱◳ Indicators recommendation :
▣ Oscillators: BUY
▣ Moving Averages: STRONG_BUY
◰◲ Technical Indicators Summary : STRONG_BUY
◳◰ Market Sentiment Index :
▣ News sentiment score is N/A
▣ Twitter sentiment score is 0.52 - Bullish
▣ Reddit sentiment score is 0.80 - Very Bullish
▣ In-depth FLMBTC technical analysis on Tradingview TA page
▣ What do you think of this analysis? Share your insights and let's discuss in the comments below. Your like, follow and support would be greatly appreciated!
◲ Disclaimer
Please note that the information and publications provided are for informational purposes only and should not be construed as financial, investment, trading, or any other type of advice or recommendation. We encourage you to conduct your own research and consult with a qualified professional before making any financial decisions. The use of the information provided is solely at your own risk.
▣ Welcome to the home of charting big: TradingView
Benefit from a ton of financial analysis features, instruments and data. Have a look around, and if you do choose to go with an upgraded plan, you'll get up to $30.
Discover it here - affiliate link -

✳️ Flamingo (Fast ALTSBTC #2)
We continue with the trade ideas with pairs that are set to move strong against Bitcoin.
The bullish signals already confirmed.
Fast ALTSBTC | Altcoins vs Bitcoin #2
---
Altcoin (PAIR): Flamingo (FLMBTC)
Trend: Up
Potential: 130% to 222%
---
Wishing you great profits and success.
This is not financial advice.
Namaste.

$FLM/#BTC [#Flamingo]: Resistance_Breakout_ConfirmationWe've detected a Resistance Breakout and Confirmation on the $FLM / $BTC chart. The price has broken above a key resistance level and has been confirmed by a strong candle, indicating a potential bullish trend. The next resistance key levels are at 0.00000462 | 0.00000485 | 0.00000532 and the major support zones are respectively at 0.00000415 | 0.00000391 | 0.00000344. We may consider entering a trade at the current price zone at 0.00000458 and targetting higher levels.
- Technical Metrics :
-- Current price: 0.00000458
-- 24H Volume: 12.7615 Ƀ
-- 24H Price change: 4.091%
- Pivot Points - Levels :
-- Resistance: 0.00000462 | 0.00000485 | 0.00000532
-- Support: 0.00000415 | 0.00000391 | 0.00000344
- Indicators recommandation :
-- Oscillators: NEUTRAL w/: 1 BUY - 0 SELL and 10 NEUTRAL
-- Moving Averages: STRONG_BUY w/: 14 BUY - 0 SELL and 1 NEUTRAL
--> Summary : BUY w/: 15 Total Buy - 0 Total Sell and 11 Total Neutral
- In-depth FLMBTC technical analysis on > Tradingview TA page

Flamingo / BTC - Bullish divergence + volumeAntshares all over again?
Do you remember Antshares in 2016 that was later renamed as Neo? Flamingo feels like Déjà vu all over again. It is a decentralised finance (DeFi) platform based on the Neo blockchain. Furthermore the founder of Flamingo co-founded Neo. Stumbled upon this alt-coin for no other reason than the interesting TA whilst scanning through the alts, so don’t worry this is not an attempt to beguile you with fundamentals.
Following two oversold conditions on the above 1-day chart there now exists an ‘incredible buy’ opportunity as a regular bullish divergence emerges. The divergence is also visible on the USD chart. In addition to the divergence the volume during the consolidation period over the past two months is unusually high for a project of this market capital (<$24m). Someone or group knows something I don't.
Target? I’ve no idea - there’s no history to work with. However given the volume and current market capital I would not be surprised if we saw a 50x return.
Any questions just leave them below.

$FLM- updatein hindsight should have waited for the wick from day before to be filled for an entry
Dixie is at a key point threating to blast up so be cautious on risk on assets
anyways usdt pair waiting on btc to break downtrend and btc pair volume creeping up .

Classic cup and handle pattern Classic cup and handle pattern same with FLM/USDT
Classic cup and handle pattern same with FLM/USDT

FLMBTC - SETUPFLMBTC price has started to break the long time accumulation zone and if bulls sustain their dominance we could see a strong rally.

flmbuy point=0.00000565
sl =5%
............................................................................................................................................................

$FLM, Trying to get traction from a reclaim of the ~1k sats $FLM
Trying to get traction from a reclaim of the ~1k sats level
UCTS 1D Buy signal active (usually strong)
Long, aiming to ~1250sats as 1st target
#FLM
$FLM, Looking for a potential reversal from the ~1050 sats level$FLM
Looking for a potential reversal from the ~1050 sats level retest
UCTS starting to change into buy signals on lower timeframes (8H as example)
/usd as reference
#FLM

FLMUSDT is creating a pennant 🦐FLMUSDT is creating a pennant. IF the price is going to have a breakout, According to Plancton's strategy (check our Academy ), we can set a nice order
–––––
Follow the Shrimp 🦐
Keep in mind.
🟣 Purple structure -> Monthly structure.
🔴 Red structure -> Weekly structure.
🔵 Blue structure -> Daily structure.
🟡 Yellow structure -> 4h structure.
⚫️ Black structure -> <4h structure.

$FLM, Looking good$FLM
Impossible to analyze everything on this busy Altcoin week but worth naming this one.
Look for a flip over the crossed level as continuation..


FLM / BTCThe sky is the limit with this one!
This chart reads 'buy me' and so I have... Relatively new and full of potential, big money locked in Liquidity Pools and this protocol is as easy to use as any of the Ethereum Defi options with Neoline attached to your Google Browser!
Trade only with what you can afford, don't trade with debt and take profits.
Alfa

FLM: The next bullish bounce is starting soon off the 100 Day MAFlamingo has not even reached its ATH yet and NEO as well. The charts are clearly showing the upward moving momentum including all of the retracements so far.
Get ready for this next big bounce!
I have predicated based on the charts every move FLM has done so far since it was below 0.30!
Fundamentally also, NEO will follow Ethereum, the same way it did in 2017/2018.

CUP after 2 weeks of retracement, it seems like a big bullish for FLM
not an investment advice ım not a professional analyst


Inverted Head and Shoulder Pattern on BTC and USDTNEO and BTC are Pumping we will see FLM go even higher.
