Calm before the storm on FlokiSEED_DONKEYDAN_MARKET_CAP:FLOKI #FLOKI #FLOKIUSD #FLOKIUSDT
Calm before the storm.
Parallel trendlines with triangle.
There will be a squeeze but to which direction?
FLOKIUSDT trade ideas

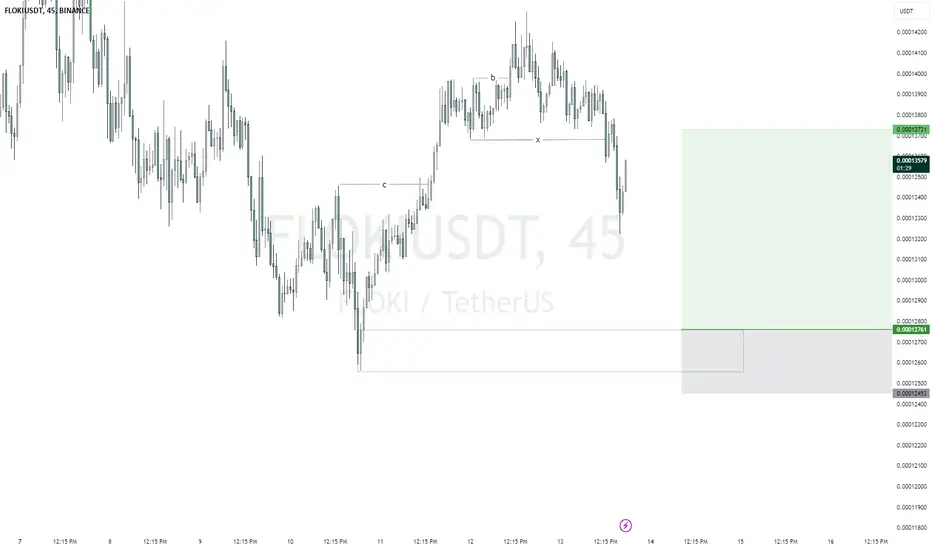
FLOKIUSDTmy entry on this trade idea is taken from a point of interest BELOW an inducement.. I extended my stoploss area to cover for the whole swing as price can target the liquidity there before going as i anticipate.. just a trade idea, not financial advise

FLOKI 1D | PlanThe area of the purple box is my zone of interest. If I see weakness in the price at this level, it could pull back to lower levels IMO.
Happy trading!

FLOKI | Meme Season Coming?Shiba killer is back?
Recent Binance news indicates that the U.S. arm of the world's largest exchange, is all set to list the popular memecoin Floki
Days after recognizing Shiba Inu’s full potential as a result of an internal review and its subsequent delisting from the Binance’s experimental “innovation zone”, the U.S. arm of the world’s largest crypto exchange announced that it will offer Floki, another flagship cryptocurrency from the memecoin genre. On Monday, April 24, the California-based Binance exchange notified its millions of users about the upcoming Floki listing which would initially be paired with both USD and USDT support. The trading for the token is said to go live tomorrow, April 25, 2023 at 5 a.m. PDT / 8 a.m. EDT. However, according to the announcement, the deposit function for FLOKI tokens are currently enabled for users to fund their crypto accounts. Binance has created seven new liquidity pools for crypto including Bitcoin, Shiba Inu, and Dogecoin in response to the growing demand for such cryptocurrencies. Moreover, emerging memecoins like Bone ShibaSwap (BONE), ArbDoge AI (AIDOGE) pumped more than 10% on news of a major exchange listing today.
As a direct consequence of this, many in the crypto community are speculating of an impending memecoin rally where market participants anticipate higher retail engagement as an increasing number of exchanges provide support for these altcoins. However, such price movements are heavily dependent on Bitcoin and a further decline from its current levels of FWB:27K would turn out to be devastating for the larger crypto market.

Floki / UsdtBINANCE:FLOKIUSDT
Floki Coin Analysis
Current Support Zone: 0.00014565
Next Resistance Level: 0.00017500
Key Points:
If the price holds at the support level, it may have potential to rise towards the next resistance.
If it breaks below the current support, downside targets could be 0.0001300 or 0.0001111.
Note: This is not financial advice; always do your own research before making investment decisions.

FLOKIUSDTFLOKI ~ 2D ✅
#FLOKI If you are interested in this meme,. It seems very interesting to buy gradually inside this pattern


flokiusdt has previously achieved more than 1000% timesThe coin KUCOIN:FLOKIUSDC has previously achieved more than 1000% times , and now is a new opportunity to invest in it.... ... There will be a slight rise as shown in the figure (No. 1)... and then the price will drop to the levels specified in No. (2)... Here you can start buying to invest... The currency will achieve family increases in this wave, don't miss it.

FLOKIUSDTmy entry on this trade idea is taken from a point of interest BELOW an inducement.. I extended my stoploss area to cover for the whole swing as price can target the liquidity there before going as i anticipate.. just a trade idea, not financial advise

FLOKIUSDTmy entry on this trade idea is taken from a point of interest BELOW an inducement.. I extended my stoploss area to cover for the whole swing as price can target the liquidity there before going as i anticipate.. just a trade idea, not financial advise

FLOKIUSDTI am expecting FLOKI to bottom out around 0.00013002 before making it's next leg up. If FLOKI breaks below these levels we are in for further downside. Should BTC break 60k we could possibly see alts bleed, however if we can find support at these levels we should she some significant upward gains.

FLOKI is in the middle of correctionFrom the place where we placed the red arrow on the chart, it seems that FLOKI's correction has started.
This correction looks like a big diametric as we are now in wave D of this diametric.
From the red range, we expect a downward price rejection.
Closing a daily candle above the invalidation level will violate this analysis.
For risk management, please don't forget stop loss and capital management
Comment if you have any questions
Thank You

Bullish trend starting upA very good risk reward ratio as crypto tokens about to take off, and NFP numbers about to be released I anticipate a rise in numbers and a huge drop in USD and USDT.D

FLOKI/USDT bearish trend consolidatedFLOKI/USDT entered a bearish trend after peaking at 0.0001747 USDT. Since then, the price has started a corrective movement, breaking below the exponential moving averages (EMAs) and entering a descending channel.
Although the indicators are showing weakness in the selling pressure, there are no clear signs of a reversal yet.
To initiate a bearish trend reversal, the price would need to break the dynamic resistance of the descending trendline and sustain above the EMA Ribbon. A break above 0.00014884 USDT would be an important signal that buying pressure is returning to the market.
In addition, the MACD would need to cross upwards and the Stochastic RSI would need to enter the overbought zone to confirm a trend change.
Let's wait for the next few hours.
Supports: 0.0001253 / 0.0001174
Resistances: 0.0001398 / 0.0001448

Kama CloudDescription:
The KAMA Cloud indicator is a sophisticated trading tool designed to provide traders with insights into market trends and their intensity. This indicator is built on the Kaufman Adaptive Moving Average (KAMA), which dynamically adjusts its sensitivity to filter out market noise and respond to significant price movements. The KAMA Cloud leverages multiple KAMAs to gauge trend direction and strength, offering a visual representation that is easy to interpret.
How It Works:
The KAMA Cloud uses twenty different KAMA calculations, each set to a distinct lookback period ranging from 5 to 100. These KAMAs are calculated using the average of the open, high, low, and close prices (OHLC4), ensuring a balanced view of price action. The relative positioning of these KAMAs helps determine the direction of the market trend and its momentum.
By measuring the cumulative relative distance between these KAMAs, the indicator effectively assesses the overall trend strength, akin to how the Average True Range (ATR) measures market volatility. This cumulative measure helps in identifying the trend’s robustness and potential sustainability.
The visualization component of the KAMA Cloud is particularly insightful. It plots a 'cloud' formed between the base KAMA (set at a 100-period lookback) and an adjusted KAMA that incorporates the cumulative relative distance scaled up. This cloud changes color based on the trend direction — green for upward trends and red for downward trends, providing a clear, visual representation of market conditions.
Benefits:
Dynamic Sensitivity: By adapting to the market's volatility, KAMA provides more reliable signals than traditional moving averages.
Trend Clarity: The color-coded cloud visually enhances the perception of the trend’s direction and strength, making it easier for traders to decide on their trading strategy.
Versatility: Suitable for various asset classes, including stocks, forex, commodities, and cryptocurrencies, across different timeframes.
Decision Support: Helps traders understand not just the direction but the strength of trends, aiding in more informed decision-making regarding entries, exits, and risk management.
Usage:
The KAMA Cloud is ideal for traders who need a robust trend-following tool that adjusts according to market dynamics. It can be used as a standalone indicator or in conjunction with other technical analysis tools to enhance trading strategies. Look for the cloud’s color shifts as potential signals for trend reversals or continuations, and consider the cloud’s thickness as an indication of trend strength.
Whether you are a day trader, swing trader, or long-term investor, the KAMA Cloud offers a unique approach to understanding market trends, helping you navigate the complexities of various market conditions with confidence.

FLOKI → A short term analysishello guys.
The chart shows a head and shoulders pattern, which is a reversal indicator.
The price formed a left shoulder, head, and right shoulder pattern, signaling a potential bullish move.
Price has broken out of the yellow support zone (neckline of the pattern), confirming the reversal.
Immediate target is around 0.00014400 USDT (blue zone).
Extended target is around 0.00016600 USDT.
The bullish structure suggests an upward movement is expected after the breakout.
___________________________
✓✓✓ Always do your research.
❒❒❒ If you have any questions, you can write them in the comments below, and I will answer them.
❤︎ ❤︎ ❤︎And please don't forget to support this idea with your likes and comment

FLOKI USD LONG RESULT Floki has been in a strong bullish trend since last week, decided to take a short trade on Friday after spotting the triple top pattern and weakness in Volume to continue to break the strong resistance.
FLOKI is still in an BULLISH trend though. This is just a Wave 2 Structure formation on my higher timeframe analysis, So still very Confident in FLOKI ✌️

By approaching its most important support range in the daily timFloki currency continues to move in a downward trend.
By approaching its most important support range in the daily time, this currency can prepare the preparations for growth.
Also, in the time of 4 hours, the yen currency can provide a small growth of 10% for itself.
But safe entry to this currency is possible after the defeat of the resistance.
Breaking this resistance means safe entry or safe moving average.
The possible movement of this currency was presented to you in this analysis.

FLOKI, showing massive UPSIDE shift.. significant ASCEND next.FLOKI, has been left by its peers lately -- returning to 1.0 FIB RETRACEMENT level -- most discounted price you can get.
Now, the coin is showing some significant accumulation / net buying volume. The upper indicator is showing some unusual white stair line length conveying strength. The usual hint before an ascend.
Expect some above average price growth from the current levels.
Spotted at 0.0000330
TAYOR
Safeguard capital always.

FLOKIUSDTFLOKI ~ 2D ✅
#FLOKI We hope that this Demand Zone will be retested to attract buyers. This scenario would be possible Dobble Bottom-up.
However, if this Demand Zone is not strong enough to withstand selling pressure and buyers lose momentum, it will be very clear that the price will fall at the key support that we expect.

FLOKI HAVE BULLISH SIGNAL!!!!!FLOKI have bullish signal
good for spot and futures
check it before buy

Floki Flying To New All Time High By October
Price has broken out from it's 75 day falling wedge pattern & given a retest.
A hidden bullish divergence on the weekly time frame provides confluence to the setup.
TP targets
180% - to current ATH & top of the Wedge
235% - to the 1.272 Fib
BONK/USD played out a very similar setup in Dec 2023, hitting a new ATH roughly a month after the initial breakout.
Cheers
BB
