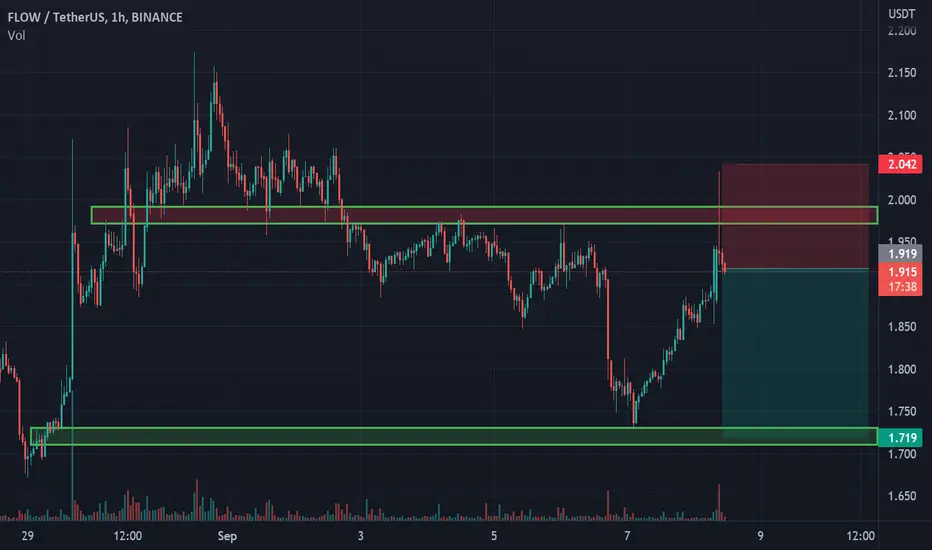
FLOW - The price is above support.After a rapid rise, we see a pullback to the lower boundary of the range. The price is kept in flat above the support from where the previous movement was resumed. In case of successful resumption of buying, the price is expected to rise.
If you liked the idea, please like it. That's the best "Thank you!" for the author 😊
P.S. Always do your own analysis before a trade. Put a stop loss. Fix profits in installments. Withdraw profits in fiat and make yourself and your loved ones happy.
FLOWUSDT.P trade ideas

FLOW LONG OPPORTUNITY 20220929Signal:
Blue -> Purple -> Blue
Strong volatility
FLOW, FLOWUSD, FLOWUSDT, FLOWUSDTPERP, FLOWBUSDPERP, CRYPTO, CRYPTOCURRENCY
DISCLAIMER
This is only a personal opinion and does NOT serve as investing NOR trading advice.
Please make your own decisions and be responsible for your own investing and trading Activities.

FLOWUSDT | TRADE IN RANGEFLOWUSDT has been trading in the range.
The price has made multiple time to break above but get rejected.
Currently, the price is standing near the top of the range.
The bulls will show strong momentum above break of range.
Trade your levels accordingly.

Flow Coin Price PredictionFlow Coin Price Prediction, i am long now because it is on it demand zone, it will range and fly up

FLOW/USDTFLOW/USDT
It is in a descending channel.
In my opinion, it should reach the level of 1.25 once again for growth.
#FLOWUSDT #FLOW #BTCUSDT #BTC #ETHUSDT #DOGE #DOGEUSDT

FLOW SHORTI see a "double top" pattern, which tells us about a potential short. I broke the level and retested. I recommend getting shorts. Stop loss per level.

FLOW bearish sentimentNext week we have the FOMC meeting.
Most likely the Federal Reserve will raise rates by 75 basis points. In case of 100 basis points increase, i expect a sell-off in the markets.
Major cryptocurrencies have seen heavy coin inflow into exchanges recently.
I expect a strong sell pressure next week.
FLOW/USDT short
Entry Range: $1.79 - 1.85
Take Profit 1: $1.69
Take Profit 2: $1.50
Take Profit 3: $1.10
Stop Loss: $2.35

FLOW⚡️⚡️#FLOW/USDT ⚡️⚡️
Exchanges: Binance Futures 🚀
Signal Type: Regular Long
Leverage: Cross (X20)
Amount:0.50%
Entry Targets:
1) 1.796
2) 1.766
3) 1.751
Take-PrOfit Targets:
1) 1.804
2) 1.836
3) 1.868
4) 1.925
5) 1.972
6) 2.018
7) 2.084
8) 2.168
9)
Stop Targets:
1) 1.730

FLOW longFLOW bounced off the ascending trendline and bounced off the support area. Bullish movement to resistance level at 2.15 is expected to happen.

FLOW trend lines#FLOW/USDT
$FLOW trend lines show price is inside ascending channel.
🐮 close the daily candle above descending trend line will confirm the continuing bullish trend.
and break out from ascending trend line that now acts as resistance will increase price toward upper ascending trend lines.
🐻 break down from the lowest ascending trend line that acts as support very well will invalidate this scenario.

FLOW: Bulls are exhaustedHello traders!
Welcome back to another episode with Analyst Aadil100x.
There was a strong rise in Flousdt and now bulls are exhausted and bearish patterns are forming. We are setting the short limit in Flow.
Flow Sell entry 1.968
Stoploss 2.03(-3.1%)
Target 1.759(+10.6%)
Thanks to the tradingview team for providing this platform.

FlowIf you like this coin, it's at golden zone. A good buy opportunity. Massive wedge on the daily, consolidation under resistance. Expecting to pull a 3x in the coming weeks. This would invalidate if it breaks current support

short flow
$FLOW bounced off the resistance level. Decline to support level at 1,71$ is likely to happen.
$FLOW the META Coin$FLOW might follow EW and printing HH and HL. Current Price might be the best place to accumulate and HODL this Coin.
META might has some effect on this Coin once Crypto Coin is moving forward
Note : not a financial advice & TAYOR

FLOW USDT up maybe???having a look at flow today. we could see a 16% move up here but be cautious as btc is a bit volatile....
this is not financial advise. do your own research.

FLOW | Head and shoulders?Daily time frame analysis. Over the past two months, FLOW has gradually formed a perfect head and shoulders pattern. This is a good opportunity to be bearish.
If the price breaks below the neckline again, a bearish signal appears. I think Flow price will drop to at least $0.85. The amplitude is the same as the height of the head and neck.
If you like and support our analysis, please give us a like and leave your comment. 😘
Good luck~☘

FLOWUSDTHello Crypto Lovers,
Mars Signals team wishes you high profits.
This is a one-day-time frame analysis for FLOWUSDT
In our last analysis on August 23, we expected a falling trend and now one of our targets is hit due to the decline. There are R3 and R2 as the resistance areas that represent the unsuccessful triumphs of the price to rise. R1 used to be a support line. S1 used to be a resistance area and S2 is our support area in which the well support of the price is obvious. At the present, we have the price fluctuating over S1 and via receiving some confirmation candles, we believe it will have two options. Either it will rise to R1 or even higher to R2. Or it will lose the support in S1 and fall below this area toward S2.
Warning: This is just a suggestion and we do not guarantee profits. We advise you to analyze the chart before opening any positions.
Wish you luck

FLOW is about to GO UP!!Looking at the Chart if $FLOW can break that trend line, then it will rise to the upside.
My Price Target is about $4, you can buy with SPOT or DCA for a leverage buy.
I will give my review on how this trade age over time..
THIS IS NOT A FINANCIAL ADVICE.
RULE 1: Don't Lose Money.
RULE 2: Don't Forget Rule No. 2.

Long scalp, but the market trend is still short.Long scalp, but the market trend is still short. According to our model, there is always a final trend before the final fall.
Considering the 4-hour time frame, this long is worth entering.
The pattern may change and the long trend will continue, but according to the current chart, I predict such a pattern.

FLOW USDT CHART flow is a hidden gem coin with a potential of 27x your money in upcoming bull run. fasten seat belsts

FLOW/USDT looks interesting!Morning guys!!
Next coin we are looking at is FLOW/USDT. Not much to say here as everything is displayed on chart! Major resistance has been approached and is now trying to secure the zone above that line. Pressure is big from sellers but even bigger from buyers. Once $2.11 zone will be broken this will be good opportunity for buys!
What are your thought about FLOW?
If you like ideas provided by our team you can show us your support by liking and commenting.
Yours Sincerely,
Swallow Team 🔱
Disclamer:
We are not financial advisors. The content that we share on this website are for educational purposes and are our own personal opinions.

FLOW bearish sentimentSeptember has major catalysts for the crypto market as well as for the stock market.
The Ethereum merge on September 6th, that will end on Sept 20, the inflation report on September 13 and the next FOMC meeting afterwards with the new interest rates hike.
That is reflected in the crypto space in general as a bearish outlook.
FLOW is a cypto with a negative overall sentiment recently.
I have the following price targets:
FLOW/USDT short
Entry Range: $1.95 - 2.10
Take Profit 1: $1.75
Take Profit 2: $1.50
Take Profit 3: $1.10
Stop Loss: $2.35

FLOWUSDT | WAITING FOR BREAKOUTFLOWUSDT has been trading in a parallel channel . The price is making lower lows and lower highs. Currently it is trading at upper boundary of channel. The same zone has confluence with 0.23 fib level. The price need to sustain above 0.23 fib level.
The bear will be active near the upper boundary of channel. The bulls need to break above the bearish channel.
Trade your levels accordingly.
