Will FLOW continue to grow?Hello everyone, let's take a look at the 1D FLOW to USDT chart as you can see the price has broken out of the downtrend channel.
Let's start by designating support sites that we can consider:
1. $ 2.69
$ 2.38
3. $ 2.16
and
4. $ 1.59
Now let's move on to the resistance that the price has on its way:
1 - $ 3.26
2 - $ 3.82
3 - $ 4.63
4 - $ 5.48
5 - $ 6.68
and
$ 6-8.20
Looking at the CHOP indicator, we can see that in the 1D range the energy was mostly used, and the MACD indicator shows a local upward trend.
FLOWUSDT.P trade ideas

potential FlOW Trade IDEAThis is my idea to trade flowusdt pair. Please consider this as educational not a financial advice.

FLOW short Entry Range, Take Profit and Stop LossFLOW/USDT short
Entry Range: $2.55 - 2.71
Take Profit 1: $2.00
Take Profit 2: $1.50
Take Profit 3: $1.10
Stop Loss: $3.35

Flow coin formed bullish Gartley for upto 17.50% moveHi dear friends, hope you are well and welcome to the new trade setup of Flow coin.
On 4-hour time frame, FLOW has completed a bullish Gartley pattern. At the moment, after complaint the final leg priceline has slightly moved up, therefore, we can wait for the price correction to catch it from the buying zone.
Note: Above idea is for educational purpose only. It is advised to diversify and strictly follow the stop loss, and don't get stuck with trade

Flow falling | forecast/ideafor Futures traders
Flow Usdt falling
Please write any comments or suggestions.
Dear friends, request any cryptocurrency or forex indices that you want to be analyzed.
Thanks for your attention

FLOWUSDTA bearish triangle completed formed and now we waiting price reaction
if breaking trendline and close down open directly short position and the TP 3.45% in chart

FLOWUSDT SHORTRisk warning, disclaimer: the above is a personal market judgment based on published information and historical chart data on Tradingview, all analysis is only subjective. Hope investors consider, I am not responsible for your investment decision. Thank you.
Good luck!

FLOWUSDTJust an update from my past idea post. As you can see at this point I've already hit my first target and about to hit my second one. I kid you not my winning trade percentage is 86.5%. I will start posting more often with before and after results of my open trades. I usually trade forex. Stay tuned people.
LIKE SUBSCRIBE AND COMMENT.

FLOW/USDTIt's been pumping which is great for people who is holding this crypto. Eventually people will start taking profits and the price will start to go down. A short position is the best to take at this point. In this chart as you can see my entry price, my stop loss, my targets and my expected final take profit price level.
I have a short position open 50X leverage and let's see how I do today.

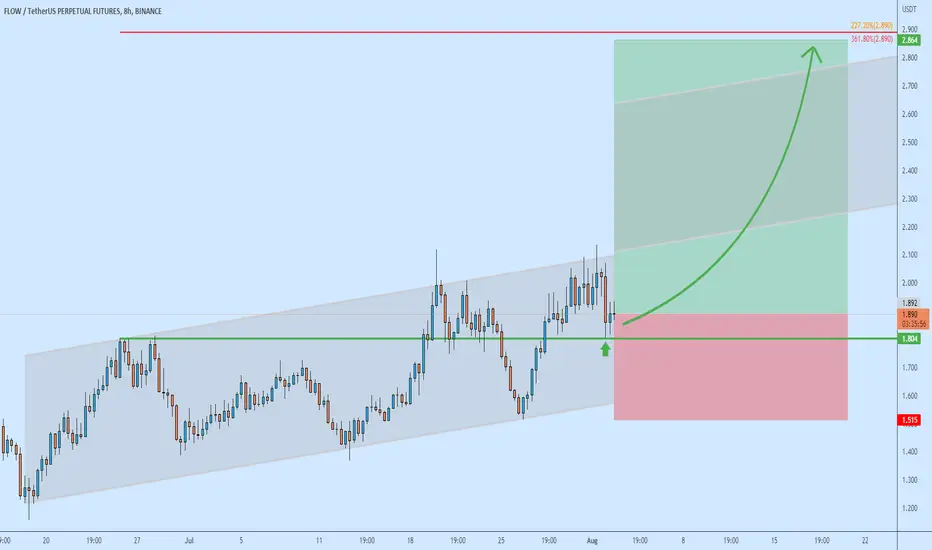
FLOW/USDT support rejected... up up upFLOW found support in the previous supply area. Price continues to move within the ascending channel, suggesting further growth. I'd expect the next wave to be more impulsive.
FLOWUSDT Bullish FlagFlowUSTD formed nice bullish flag in hourly/15Min time frame.
Target price: 3.5
Stop Loss: 2.5

#FLOW breakout$FLOWUSD - 4h Chart
Entry: 1.95$
Stop-Loss: 1.86$
Target: 2.30$
Risk Reward Ratio: 3.4

FOLW/USDT Analysis Update 📈📉
Hello traders, what's going on today ?!
As you can see in ,Since 20 Jan 2022, that I posted the last analysis for FLOW, after retesting prior pivot zone ,as other altcoins it has been declining until now and recently and even lost the lowest support level by a massive drop . (more than 80 %💰 (1x)short).
So in today analysis on the Daily timeframe for flowusdt , as you can see the impulsive downward wave(12345 of Elliot waves) it has been declining til now but recently it started an uptrend corrective wave (ABC), and it is trading above a strong support zone , and also some positive divergence have revealed recently , so more likely can rise over here , and if it be able to breakout the decending trendline then can rise more and see the higher resistance zone. but if it loses the recent support it can even fall on the lower support FIBO lvls.
✌️ Good luck with your trading and investing and remember: Trade smart…OR JUST DON’T TRADE!
--------------------------------------------------------------------------------------------------------------------
👉This analysis is my personal opinion ,not a financial advice ,so do your own research.
💜 if you're fan of my analyses please follow me , give a big thumbs 👍 OR drop a comment 🗯

FLOWUSDT - Looking For Trade Setups In A Bear Market.This is just a trade idea I thought I would share.
I identified this pattern using AriasWave and I thought I would share my approach on how I am shorting this.
I do not know anything about the project but I do know about waves.
AriasWave can be used on any chart and on any timeframe.
Always proceed with caution as my videos are just me sharing what I am doing and it doesn't mean you should do the same.
Remember to use Disciplined Money Management Principles to ensure longevity as a trader.
If you don't know the long term pattern shouldn't you be doing your research instead of just following the crowd?
Just remember: I am not a financial adviser, I suggest using this only as a guide. Always do your own research.


FLOWUSDT - Long - Potential 40.97%Nice Pennant breakout, completed a pullback and smashed through overhead resistance. Massive room for growth for a chain trusted by some big players but so intrinsically linked to the NFT boom that it likely needs to rehab its image a bit to bring retailers back into the mix.
I bought and held since spring 2021. With the plan to sell on the binance listing news, not following through with that was a big mistake so hopefully it makes some moves on the back of the technicals illustrated and I can DCA my position to profit. I always feel like FLOW is just one big announcement away from $20, but my confidence in that is as low it has ever been.
Thoughts?

FLOWUSDTHello Crypto Lovers,
Mars Signals team wishes you high profits.
This is a one-day-time frame analysis for FLOWUSDT
As we predicted on July 6, we expected a rising trend and now you observe that it is happening. Here we have R2 as our resistance line and it shows the disability of the price in order to rise. R1 used to be a support line and S1 and S2 are the support areas that include the support of the price at some points. At the moment, we see the price fluctuating below R1 and we believe it will rise to the mentioned line and then it will face a decline to S1 and even below it. But in case it moves above R1 and fixes there, we will predict more rise for the price up to R2 and even higher.
Warning: This is just a suggestion and we do not guarantee profits. We advise you to analyze the chart before opening any positions.
Wish you luck

FLOWIf 4H candle closes above the red zone the trend is bullish, else it will be bearish and maybe will hit 1.54.

FLOWUSDT (4H) Bearish reversalHi Traders
FLOWUSDT (4H Timeframe)
Waiting for the downward break of 1.590 support level which will complete a bearish trend reversal pattern to go SHORT. Only the upward break of 1.730 would cancel the bearish scenario.
Trade details
Entry: 1.590
Stop loss: 1.730
Take profit 1: 1.500
Take profit 2: 1.410
Score: 5
Strategy: Bearish reversal

FLOWUSDTHello Crypto Lovers,
Mars Signals team wishes you high profits.
This is a one-day-time frame analysis for FLOWUSDT
Here we have R1 as our resistance line and it shows the price was unable to rise. S2 is the support line and as well as S1 (a 4-hour support line) represents the support of the price at some points. At the present, the price is fluctuating in a descending channel and on S1 and we expect it to rise to R1 and by the time it moves above R1 and we receive confirmation candles, we will predict more rise for it. Even it is possible for the price to move below S1 and by a pull back to S1, again experience another fall toward S2. The point that the price will have a pull back, is considered a good area to enter or leave trading. But please consider stop loss points to have less risky trades.
Warning: This is just a suggestion and we do not guarantee profits. We advise you to analyze the chart before opening any positions.
Wish you luck

FLOW shortFLOW broke trough the ascending trendline. Asset broke trough the support level. Bearish movement to support level at 1.32 is possible.


FLOW longFLOW broke trough off the upper boundary of descending channel. Asset bounced off the support level. Bullish movement to resistance level at 1.95 is possible. If the next resistance level will be broken up the FLOW is supposed to reach 2.35.
