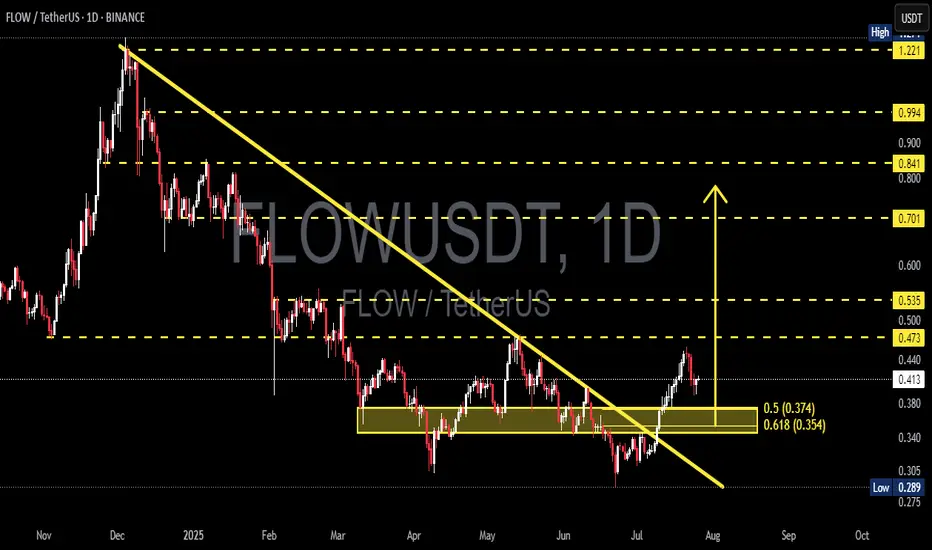
FLOWUSDT Breakout + Golden Pocket Retest: Ready to Explode?After being trapped in a persistent downtrend for months, FLOW has finally shown a major technical signal: a clean breakout from the dominant descending trendline that has defined price action since late 2024.
This breakout isn’t just visually appealing — it’s backed by strong technical confluence, including a key demand zone, Fibonacci retracement support, and potential shift in market psychology.
---
🧠 Technical Structure & Chart Breakdown
📉 Descending Trendline Breakout
The major downtrend line has been decisively broken, indicating that bearish pressure is weakening. This is an early but powerful sign that momentum may now be shifting toward the bulls.
🟨 Consolidation Zone & Flip Area (Yellow Box)
The $0.354–$0.374 zone has acted as:
Former resistance during sideways consolidation
Potential new support after the breakout (support-resistance flip)
📊 Fibonacci Retracement Levels
0.5 Fib = $0.374
0.618 Fib = $0.354
This area, also known as the "Golden Pocket", is one of the most critical levels in technical analysis. It often acts as a launchpad during bullish retests.
---
🟢 Bullish Scenario: Textbook Retest Before a Rally?
If the price holds and reacts positively from the $0.354–$0.374 zone, the following upside targets come into play:
1. 🎯 Target 1: $0.473 – Previous range resistance
2. 🎯 Target 2: $0.535 – Key horizontal level
3. 🎯 Target 3: $0.701 – Historical resistance
4. 🎯 Extended Target: $0.841 – $0.994, potentially up to $1.221 in a strong bullish expansion
For this scenario to play out, bulls must push a daily close above $0.473 to confirm strength and break market structure.
---
🔴 Bearish Scenario: False Breakout Ahead?
If the price fails to hold the golden pocket support:
The breakout could turn into a bull trap
The price may retrace toward:
$0.305 – Local support
$0.289 – The previous low
A strong bearish candle with volume below $0.354 would invalidate the breakout and may signal renewed downward pressure.
---
💡 Conclusion: Critical Decision Point Ahead
FLOWUSDT is now at a pivotal point. The breakout has happened — but the retest zone will decide everything. Will it serve as the foundation for a larger bullish rally, or will it mark the start of another bearish wave?
Watch price action closely around $0.354–$0.374 — that’s where smart money makes their move.
#FLOWUSDT #CryptoBreakout #TechnicalAnalysis #GoldenPocket #RetestZone #FibonacciLevels #AltcoinSetup #CryptoMomentum #FlowAnalysis
FLOWUSDT trade ideas
FLOWUSDT 1D AnalysisFLOW ~ 1D Analysis
#FLOW Buy back from this support block with a short term target of at least 15%+ From here.

Good time to buy FLOWUSDT (33% Signal)FLOW has successfully consolidated above a major support area. The main target is $0.621 but a less risky exit point would be $0.57.

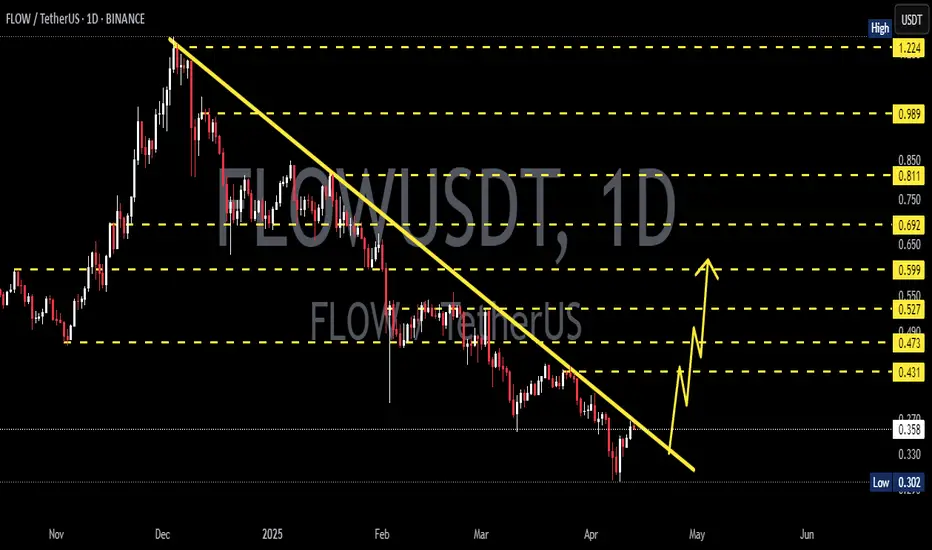
FLOWTrend: Overall downtrend since 2023, but currently bouncing from the lower boundary of the channel.
Current Price: $0.406, up 8.27% this week – a bullish sign.
Support Zone: Around $0.33–$0.35 (lower boundary of the descending channel).
Resistance Zone: $0.70–$0.80 short-term, and $1.28 long-term (upper channel boundary).
🧠 Summary:
FLOW shows signs of a potential reversal from the bottom of a long-term channel. If it continues to respect this bullish momentum, it could target higher resistances, possibly even approaching the $1+ zone in the coming months.

Flow: Your Altcoin ChoiceBefore starting, I want to show you the linear chart for FLOWUSDT. I always use the log. chart to be able to see the high and lows and the candles more clearly.
When the candles become flat and almost invisible, it means the market is trading at bottom prices. This is FLOWUSDT long-term:
This applies to all pairs and Cryptocurrency projects. When the candles become almost invisible, it means that the current neutral market cycle has been exhausted. Next comes the bull market.
Now we can go to the full chart with all the data and drawings.
The logarithmic chart reveals all the info but it is hard to appreciate how low really a Crypto pair is trading in relation to past action. This is very important if you do your own technical analysis and numbers. This is important if you do your own search for good entry prices. Just go linear and see what the chart reveals.
FLOWUSDT is trading at a new All-Time Low. The ATL session has no bearish volume but instead is about to close green. Bears are gone. They had control of the market for so long, but this is over now.
A new ATL is good because it opens the doos for new players and also maximum growth. A bull market cannot come out of a new All-Time High. Out of an All-Time High, only a bear market can develop. Out of bottom prices, we can see sustained long-term growth. So there is always some positive that can be extracted out of the negative.
When prices are high, all is good because we are growing; there is money and there are profits. When prices are low, all is good because we can prepare for a growth phase. Regardless of how you look at it, everything is always nice, good, positive and great. Adopt the right mentality and you're bound to achieve success.
It is impossible to mistake the action on the chart. A bear market, a sideways market and then comes... A bull market.
» The bear market is marked as (1) on the chart.
» The sideways market is marked as (2).
» The bull market comes next, (3).
I am keeping it simple, because there is not much more for me to say; I am keeping it simple, because simple is best.
Namaste.

FLOWUSDT 1DFLOW ~ 1D Analysis
#FLOW Buy gradually after successfully penetrating this resistant line with a short -term target of at least 10%+.
Flowusdt.pHello friends
We will have the analysis of the currency flow, stay with me
We have 3 entry points in a stepwise manner
0.352
0.288
0.25
But the targets for saving profit
1.668
4.331
18
Please observe capital management, our view for this coin is medium and long term
Be successful and profitable🌹
FLOW/USDT 1W🩸 EURONEXT:FLOW ⁀➷
#Flow. Macro chart Another
💯 Intermediate Target - $2.90
🚩 Macro Target 1 - $4.00
🚩 Macro Target 2 - $6.30
🚩 Macro Target 3 - $9.36
- Not financial advice, trade with caution.
#Crypto #Flow #FLOW #Investment
✅ Stay updated on market news and developments that may influence the price of Flow. Positive or negative news can significantly impact the cryptocurrency's value.
✅ Exercise patience and discipline when executing your trading plan. Avoid making impulsive decisions driven by emotions, and adhere to your strategy even during periods of market volatility.
✅ Remember that trading always involves risk, and there are no guarantees of profit. Conduct thorough research, analyze market conditions, and be prepared for various scenarios. Trade only with funds you can afford to lose and avoid excessive risk-taking.

FLOWUSDT 6DFLOW ~ 6D Analysis
#FLOW This is the lowest support block for now. Buy from here with a minimum target of 20%+.

FLOW can fly#FLOW is on its demand before that made an ABC pattern with a triangle at the middle of it its a correction structure so now its a good time for this coin to rise !

FLOWUSDT 1WFLOW ~ 1W Analysis
#FLOW In Time Frame 1W re -test this support, buy from here if you still have a conviction on this coin with a minimum target of 20%++

SPOT FLOW LONG 21.01.2025Pinning after containment of sales.
🎯Purpose:
0.877
I'll let you know when I record it manually.
‼️Risk per trade: 1% of the allocated funds for spot trading.

#FLOW (SPOT) IN ( 0.600- 0.750) T.(6.900) SL(0.556)BINANCE:FLOWUSDT
#FLOW/ USDT
Entry ( 0.600- 0.750)
SL 1D close below 0.556
T1 1.100
T2 1.550
T3 2.600
T4 4.100
T5 6.900
______________________________________________________________
Golden Advices.
********************
* collect the coin slowly in the entry range.
* Please calculate your losses before the entry.
* Do not enter any trade you find it not suitable for you.
* No FOMO - No Rush , it is a long journey.
Useful Tags.
****************
My total posts
www.tradingview.com
**********************************************************************************************
#Manta #OMNI #DYM #AI #IO #XAI #ACE #NFP #RAD #WLD #ORDI #BLUR #SUI #VOXEL #AEVO #VITE #APE #RDNT #FLUX #NMR #VANRY #TRB #HBAR #DGB #XEC #ERN #ALT #IO #ACA #HIVE #ASTR #ARDR #PIXEL #LTO #AERGO #SCRT #ATA #HOOK #FLOW #KSM #HFT #MINA #DATA #SC #JOE #RDNT #IQ #CFX #BICO #CTSI #KMD #FXS #DEGO #FORTH #AST #PORTAL #CYBER #RIF #ENJ #ZIL #APT #GALA #STEEM #ONE #LINK #NTRN #COTI #RENDER #ICX #IMX #ALICE #PYR #PORTAL #GRT #GMT #IDEX #NEAR #ICP #ETH #QTUM #VET #QNT #API3 #BURGER #MOVR #SKL #BAND #ETHFI #SAND #IOTX #T #GTC #PDA #GMX #REZ #DUSK #BNX #SPELL #POWR #JOE #TIA #TFUEL #HOT #AVAX #WAXP #OGN #AXS #GALA #ONE #SYS #SCRT #DGB #LIT #QI #FIL #GLMR #ATOM #LTC #MANA #ONT #TLM #SLP #ROSE #NEO #EGLD #CHR #FLOW

$FLOW - ON THE RUNWAY!The big wave 1 of FLOW created a BOS that broke the previous long-term downtrend. After this break, the price returns to the previous cumulative area test and is signaling back to the upward momentum from today!
The accumulation phase is 5 months long (from June - November), if you zoom in on the chart, you can see that this accumulation phase is a Spring shot according to Wyckoff theory. The price area below $1.5 is most likely the long-term accumulation area of FLOW.
Therefore, if you only trade #spot, buy at the price below $0.8 to get the best entry.

FLOW way to 15$🚀 FLOW 🚀
Wave 1 and Wave 2 have been completed
We are now entering Wave 3, which will be part of a five-wave sequence
Wave 3 Target: $5.20 - $6.30
Wave 5 Target: $15.00
If you appreciate my analysis,
please like, follow, and repost to keep me motivated
#NFA
#DYOR

FLOW/USDTKey Level Zone : 0.805 - 0.815
HMT v4.1 detected. The setup looks promising, supported by a previous upward/downward trend with increasing volume and momentum, presenting an excellent reward-to-risk opportunity.
HMT (High Momentum Trending):
HMT is based on trend, momentum, volume, and market structure across multiple timeframes. It highlights setups with strong potential for upward movement and higher rewards.
Whenever I spot a signal for my own trading, I’ll share it. Please note that conducting a comprehensive analysis on a single timeframe chart can be quite challenging and sometimes confusing. I appreciate your understanding of the effort involved.
Important Note :
Role of Key Levels:
- These zones are critical for analyzing price trends. If the key level zone holds, the price may continue trending in the expected direction. However, momentum may increase or decrease based on subsequent patterns.
- Breakouts: If the key level zone breaks, it signals a stop-out. For reversal traders, this presents an opportunity to consider switching direction, as the price often retests these zones, which may act as strong support-turned-resistance (or vice versa).
My Trading Rules
Risk Management
- Maximum risk per trade: 2.5%.
- Leverage: 5x.
Exit Strategy
Profit-Taking:
- Sell at least 70% on the 3rd wave up (LTF Wave 5).
- Typically, sell 50% during a high-volume spike.
- Adjust stop-loss to breakeven once the trade achieves a 1.5:1 reward-to-risk ratio.
- If the market shows signs of losing momentum or divergence, ill will exit at breakeven.
The market is highly dynamic and constantly changing. HMT signals and target profit (TP) levels are based on the current price and movement, but market conditions can shift instantly, so it is crucial to remain adaptable and follow the market's movement.
If you find this signal/analysis meaningful, kindly like and share it.
Thank you for your support~
Sharing this with love!
HMT v2.0:
- Major update to the Momentum indicator
- Reduced false signals from inaccurate momentum detection
- New screener with improved accuracy and fewer signals
HMT v3.0:
- Added liquidity factor to enhance trend continuation
- Improved potential for momentum-based plays
- Increased winning probability by reducing entries during peaks
HMT v3.1:
- Enhanced entry confirmation for improved reward-to-risk ratios
HMT v4.0:
- Incorporated buying and selling pressure in lower timeframes to enhance the probability of trending moves while optimizing entry timing and scaling
HMT v4.1:
- Enhanced take-profit (TP) target by incorporating market structure analysis

FLOW Long - Altcoin PumperyGift me a sub if this idea works out ;) Yummy looking short ratio as well as this untouched level makes me feel pretty confident on this fella.

TradeCityPro | FLOWUSDT New Weekly Move?👋 Welcome to TradeCityPro Channel!
Let’s analyze the weekly crypto watchlist together during the final hours of the market holiday.
🌐 Overview Bitcoin
Before diving into today’s altcoin analysis, let’s take a quick look at Bitcoin. In the 1-hour timeframe, Bitcoin has broken its trendline but remains below the key resistance level of 98606, which it has been rejected from twice, highlighting its significance.
At the start of the new week, I anticipate a potential upward move, likely during the U.S. session. If Bitcoin breaks 98606, a long position can be opened. If Bitcoin dominance is breaking 57.08 simultaneously, long positions on Bitcoin itself are preferable. Otherwise, if dominance faces rejection or forms red candles, a quick switch to altcoins is recommended.
📊 Weekly Timeframe
In the weekly timeframe, this altcoin, like most of the crypto market, is still in its range box, continuing its oscillation within this boundary.
After breaking 0.674, FLOW attempted to reach the range’s upper boundary but faced rejection. Even RSI was rejected at 70, preventing FLOW from reaching the resistance at 1.460.
On the positive side, during this pullback, the volume of red candles decreased, and FLOW is now at a previous resistance-turned-support level, suggesting the potential for a rebound.
Keep in mind that the main support level is 0.463. If it breaks, exiting this coin would be wise. A re-entry can be considered upon a breakout above 1.460 with momentum confirmation.
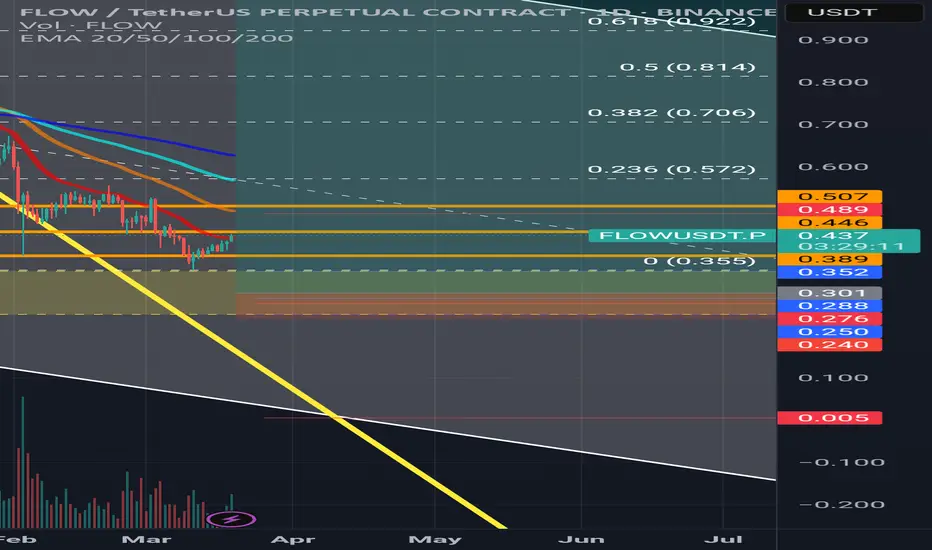
📈 Daily Timeframe
In the daily timeframe, after a fake breakdown below the key support level of 0.509, FLOW bounced back strongly, initiating a move toward the resistance at 1.169.
If we use Fibonacci levels (ignoring fakeouts), the 0.7 level emerges as a key support. It acts as a previous resistance-turned-support and aligns with the significant 0.618 Fibonacci retracement level.
The 0.7 level has been tested twice, with the price bouncing each time. If FLOW breaks 0.809, it could start a move toward 0.969 and eventually 1.169.
For spot buying, wait for a breakout above 0.809, with: Risky Stop-Loss: 0.7 Conservative Stop-Loss: 0.509 For futures trading, consider a position after a breakout above 0.809.
The resistance level at 0.809 is crucial, offering a solid opportunity for both spot and futures trades.
📝 Final Thoughts
Stay calm, trade wisely, and let's capture the market's best opportunities!
This analysis reflects our opinions and is not financial advice.
Share your thoughts in the comments, and don’t forget to share this analysis with your friends! ❤️

Flowusdt for buy.Price broke out of a falling wedge, currently formed a flag but there is a major resistance zone slightly above it. Wait for the breakout of the flag and the resistance zoneand wait for retest with a bullish candlestick confirmation candle.

flow coin long position opportunityflow coin long position opportunity - analysis only, no advice
target 1 - 7.95
target 2 - 13.8
all time low - 2023
$0.3921

Flow: From Hype to Reality Check
BINANCE:FLOWUSDT is a blockchain designed for games, applications, and NFTs. It was developed by Dapper Labs, the creators of NBA Top Shot and CryptoKitties.
FLOW Token Utility:
1. Pay transaction fees on the Flow network.
2. Staking to secure the network and earn rewards.
3. Access storage on the blockchain.
4. Governance participation (planned for the future) through voting on network decisions.
Economic Model:
* Inflationary model: New tokens are issued annually (~3-5% inflation).
* Burn mechanism: Part of transaction fees is burned to offset inflation.
* Token distribution:
* 52% — Ecosystem and development
* 20% — Team
* 28% — Investors
Main Risk: Inflation.
Technical Analysis Outlook:
In reality, this appears to be a dying token. Its fate seems to be continuous decline, confirmed by the impulsive nature of the downward movement. However, considering the current market conditions, there is a high probability that the token will correct 50% of its decline, potentially reaching the $4 mark.
The minimum target is $2.5.

FLOW can fly !#FLOW has similar pattern to many alt coins the correction waves made a good potential for a big rising wave but i think there should be another drop before the big rise !

#FLOW (SPOT) entry range (0.480- 0.580) T.(1.183) SL(0.437)BINANCE:FLOWUSDT
entry range (0.480- 0.580)
Target1 (0.658)- Target2 (0.913)- Target3 (1.183)
SL .1D close below (0.437)
*** Collect in the entry range ****
**** #Manta ,#OMNI, #DYM, #AI, #IO, #XAI , #ACE #NFP #RAD #WLD #ORDI #BLUR #SUI #Voxel #AEVO #VITE #APE #RDNT #FLUX #NMR #VANRY #TRB #HBAR #DGB #XEC #ERN #ALT #IO #ACA #HIVE #ASTR #ARDR #PIXEL #LTO #AERGO #SCRT #ATA #HOOK #FLOW ****
