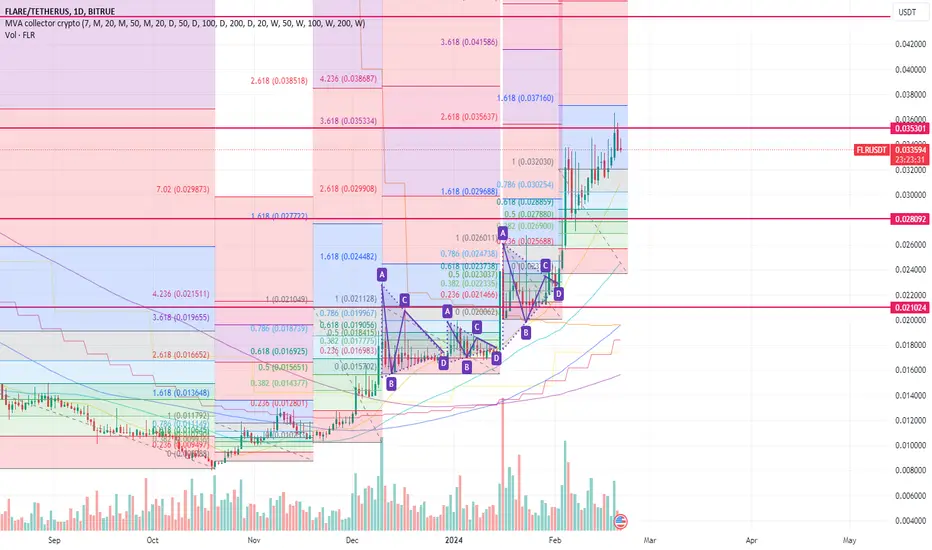
FLR Long IdeaI don't want to predict too many bottoms, but what I see here is a nice ABC correction. It went down to the 0.5 fib level, now there should be another wave of impulse next.
I have marked the areas where it may see a reaction up and down, but regardless of this, I will wait for it to make a new peak.
FLRUSDT trade ideas

Flare wave count could be indicating a major drop incoming!The current wave count on FLR could be indicating that a big drop is incoming. If price fails to get above the top box, then it will likely come down to the range of the lower one. However, if it breaks through the upper box, then that area could act as a launching pad for much higher prices. We will have to watch and see how it plays out over the next few days and reassess.
Good luck, and always use a stop-loss!

#FLR/USDT breaks the Diagonal Trendline and currently retesting #FLR/USDT breaks the Diagonal Trendline and currently retesting it in 4-Hour TF!
If it is rejected from here, we can short $FLR. #FLRUSDT local resistance level is PDL $0.03650 and the strong support level is PWL $0.03365.
Wait for confirmation to short it.

Can FLR catch fire in it's first ALT season? 🔥🚀FLR has shown increasing demand and price growth over the past few months, but I still believe there is a ton of opportunity for growth. Here I will share some weekly levels and some possible higher side targets for this ALT season. I'm not much on TA and I don't spend a lot of time with charts and indicators, I just think this coin has a lot of potential, so I thought I would share.
At it's current price, which is .043, I do see a possibility of a small amount of downside before reloading and resuming the uptrend. I do like the price right now and will continue to add if it does correct a bit more. I expect at least a 10X increase from here throughout 2025, but we could see a lot more according to the chart. I will try to add some lower TF charts to get a better idea of the current trend, but I'm not familiar with the platform (even after 3 years), so we will see. Good luck all!
This is not financial advice and always DYOR before investing in anything!

flrSupport and press the rocket to cheer me up
Observe the ten percent loss limit
Stay away from Bitcoins
Feel free to buy and sell and post your comments

FLR/USDT assessing resistance and trendline?🚀FLR Today AnalysiS💎 Paradisers, take a moment to observe #FLRUSDT as it embarks on an interesting journey. Currently, the price is testing an ascending trendline and facing a crucial resistance at $0.03848. A breakthrough above this level could launch a significant bullish campaign to overcome even tougher resistance.
💎 On the flip side, if NYSE:FLR struggles to surpass this resistance, it's time for a strategic pivot. As astute traders, we're anticipating a bullish recovery from the lower support at $0.03473, including a Fair Value Gap (FVG) level. Given that liquidity has been tapped below this point, a bullish reversal seems highly probable.
💎 Falling beneath this additional support level could indicate a shift towards a more defined bearish trend, marked by increased selling pressure. Staying vigilant and adaptable is crucial as we navigate the evolving #FLR market dynamics.


FLARE pressing the MAX PAIN button before LIFFOFF? Or SELLOFF?There is a concept in cryptocurrency trading... "Max Pain."
But first, we have to understand a Bull Flag Pattern .
In the context of a highly volatile cryptocurrency marketplace, a **bull flag pattern** is a significant indicator in technical analysis ⁶⁷⁸. This pattern is typically formed during an uptrend and is considered a continuation pattern, suggesting that the price is likely to continue rising ⁶⁷⁸.
The bull flag pattern consists of two main components: the **pole** and the **flag**⁶⁷⁸. The pole represents a robust upward price movement, while the flag represents a period of consolidation or sideways price movement ⁶⁷⁸.
When a bull flag pattern is identified, and the sellers' pressure is exhausted, it often indicates a potential upward breakout⁶⁷⁸. This is because the consolidation period (the flag) allows for the accumulation of buyers, and once this period ends, the buying pressure can push the price upwards⁶⁷⁸.
The expected outcome, based on the history of candlestick chart patterns, is that the price will continue upwards roughly the length of the pole⁶. This is known as the measured height method ⁶. However, if the support of the bull flag is breached, it indicates that the pattern is invalid and a continuation is unlikely⁶.
(1) Crypto Trading 101: Bull and Bear Flags (And What They Mean ... - CoinDesk. www.coindesk.com
(2) A Comprehensive Guide to the Flag Patterns and How to Trade Bull and .... www.kucoin.com
(3) Bull Flag Pattern: Explaining the Bullish Crypto Indicator. dydx.exchange
(4) How to Read the Most Popular Crypto Candlestick Patterns. academy.binance.com
(5) How To Read Crypto Candlestick Charts | Ledger. www.ledger.com
(6) Bitcoin Real-Time Candlestick Patterns (BRTI) - Investing.com. www.investing.com
(7) How To Read Crypto Candlestick Charts - Easy Tricks To Understanding .... cryptowhat.com
(8) 16 Types of Candlestick Patterns in Crypto. site.zenledger.io
(9) Bull Flag Pattern in Crypto: Meaning and How to Identify - CoinGape. coingape.com
(10) Bull Flag Pattern - What Is It? How To Use It?. site.zenledger.io
When a bull flag pennant is broken to the downside, it typically indicates a ** failed pattern ** ². This means that the expected upward breakout did not occur; instead, the price has broken through the lower boundary of the pennant².
This can signal that the previous upward trend is weakening, and a downward trend may be beginning ². Traders might interpret this as a sell signal, as it suggests that the buying pressure has been overcome by selling pressure².
However, it's important to note that technical analysis is not foolproof, and other factors can influence the price movement. Therefore, traders usually use these patterns with other indicators and tools to make more informed trading decisions ².
(1) Bull Flag Trading Pattern Explained | TradingSim. www.tradingsim.com
(2) Bull Pennant Pattern: What It Is, Indicates, and Examples - Bullish Bears. bullishbears.com
(3) Bullish Pennant Pattern - New Trader U. www.newtraderu.com
(4) How To Trade The Bull Pennant Pattern - HowToTrade.com. howtotrade.com
(5) Learn about Bull Flag Candlestick Pattern | ThinkMarkets | UK. www.thinkmarkets.com
MAX PAIN.
"Max Pain" is a term used in options trading to describe a situation where the market price of particular securities close to expiration tends to expire worthless². This is based on the Maximum Pain Theory, which states that there will be a maximum loss to investors who buy and hold option contracts until the expiration date².
The concept of Max Pain is derived from the observation that the price of an underlying stock tends to gravitate towards its "maximum pain strike price"—the price where the most significant number of options (in dollar value) will expire worthless¹. This is the strike price with the most open options contracts (i.e., puts and calls), and it is the price at which the stock would cause financial losses for the largest number of option holders at expiration¹.
The Maximum Pain theory works under the assumption that near the expiration date, buying and selling stock options leads to price movements towards the point of maximum pain, or market makers manipulate price indices to gain more from the closing stock price².
The calculation of the Max Pain point involves the summation of the dollar values of outstanding put and call options for each in-the-money strike price¹. For each in-the-money strike price for both puts and calls, you find the difference between the stock price and strike price, multiply the result by open interest at that strike, and add the dollar value for the put and call at that strike¹.
However, it's important to note that the Maximum Pain Theory is somewhat controversial. Critics are divided on whether the maximum pain behavior of the close stock prices occurs by chance or is a matter of market manipulation².
(1) Max Pain (Options) - Overview, How It Works, Calculation. corporatefinanceinstitute.com
(2) Max Pain Explained: How It's Calculated, With Examples - Investopedia. www.investopedia.com
(3) What Is Max Pain in Options Trading? | SoFi. www.sofi.com

FLR long setup hello Traders, here is the full analysis for this pair, let me know in the comment section below if you have any questions, the entry will be taken only if all rules of the strategies will be satisfied. I suggest you keep this pair on your watchlist and see if the rules of your strategy are satisfied. Please also refer to the Important Risk Notice linked below.

FLARE Posting up on a nice Bull-Flag PatternLet's explore the fascinating world of **bull flag patterns** in the context of highly volatile assets like cryptocurrencies.
**What Is a Bull Flag Pattern?**
- A **bull flag pattern** is a technical chart pattern that appears during an **uptrend** .
- It consists of two main components:
- **Flagpole** : A steep rise in price (represented by long green candlesticks).
- **Flag**: A consolidation phase with shorter red and green candlesticks forming a flag shape.
- The flag section is either **horizontal or slightly downtrending** .
- **Volume** : Traditionally, a bull flag has **higher volume** during the flagpole stage and **decreasing volume** during consolidation.
- **Breakout**: If the pattern plays out as expected, the flag eventually breaks the top resistance level and continues its upward movement.
**Expected Outcomes of a Bull Flag Pattern**:
- **Continuation Pattern** : Bull flags are considered **continuation patterns** because they indicate a brief pause (consolidation) within an overall bullish trend.
- **Bullish Bias**: Traders typically enter **long positions** during the flag phase, expecting further upward price movement.
- **Profit Opportunity**: The goal is to profit from buying during consolidation and leveraging the next price spike.
- **Measured Move**: The distance from the start of the flagpole to the top of the flag can be used to estimate the potential price target after the breakout.
**Trading Considerations**:
- **Entry Signal**: Traders use bull flag patterns as an **entry signal** to buy assets they believe will continue the uptrend.
- **Momentum Traders**: Bull flags are popular among **momentum traders** who seek assets with upside potential.
- **Timing**: Entering during the flag phase or as a new breakout begins with higher volume can be effective.
**Example**:
- Suppose Bitcoin forms a bull flag on the daily chart.
- If the breakout occurs as expected, the measured move could see Bitcoin shoot up significantly from the lowest area of the flag pattern.
Remember that while bull flags provide valuable insights, they are only sometimes accurate. Traders should combine technical patterns with other indicators and risk management strategies for informed decision-making. 🚀📈
For more detailed analysis, consult real-time charts and consider other factors influencing the crypto market! 🌐
(1) Bull Flag Pattern in Crypto: Meaning and How to Identify - CoinGape. coingape.com
(2) . bing.com
(3) Bull Flag Pattern: Explaining the Bullish Crypto Indicator. dydx.exchange
(4) Bitcoin Bangs Out A Bull Flag Pattern: A Technical Look At The .... www.benzinga.com
(5) A Comprehensive Guide to the Flag Patterns and How to Trade Bull and .... www.kucoin.com
(6) Spotting a Bull Flag Pattern | SimpleSwap. simpleswap.io
(7) undefined. cointelegraph.com
(8) undefined. beincrypto.com

3 Crypto Pairs To Watch This WeekWhen you are trying to understand crowd psychology it takes a mindset shift
to learn technical analysis. But inside this market, we have binary options
gamification
Going on, in short, this type of trading is like gambling
What if you could not gamble and trade knowing technical analysis?
watch this video to learn more
Disclaimer: Please take this as a warning do not buy or sell anything I recommend to you
you will lose money trading do your own research before you buy or sell anything.This is not financial advice.


Flare FlrFLR Bullish. After reaching the target I think it will slowly go up to new ATH by forming new bullish flags one after another.
What is Flare (FLR)?
Flare is an EVM-based layer 1 aiming to make blockchain more useful by giving developers decentralized access to high-integrity data from other chains and the internet. This enables new use cases and monetization models, while allowing dapps to serve multiple chains through a single deployment.

FLARE needs more consolidationFLARE will have an explosive bullrun but before that it needs to flush out every week hand and find the true bottom. Whales gonna try hard to surpress this coin as much as they can before the first big wave can finally start.

FLR launching?We've been lucky enough to watch the parabolic begin on Flare's chart. This plots a Fibonacci retracement from the recent breakout and lays down support that we might retest.

FLR/USDT Major trend. Downward channel. 21 10 2023Main trend. Time frame 3 days. Due to airdrop and the general trend of alts movement, the trend is pronounced downward. The price is moving in a descending channel. With a high probability in the near future may occur after a significant drop in price corrective movement to it, so as not to spoil the logic of the channel for the market maker. The percentages have shown. It is worth noting that locally can be formed as before candle “hammer” (bullish signal).
Line chart.
Local trading situation at the moment . Time frame 1 day.
You should always have a $ reserve of 30% of your position in case the Corona-dump 2020 fractal occurs.

PARABOLIC FLARE !I've called Flare a Phoenix rising against the selling pressure against the guys dumping from the distribution airdrops.
If we look at the recent movement, this is a parabolic price rise. Where I grow concerned is where the support levels of this acceleration need to be correctly built under the value expressed in the current FLARE pricing. If not, we could see a sudden and violent drop in pricing when a whale decides to take profits.
While I'm happy to see the skyrocket take flight, I caution that we could see a strong pullback before breaking back into prior airdrop pricing.
Hold on.
The FLARE cup & handle is evolving nicely!Flare has been forming a cup & handle formation for quite some time now. It appears that the cup is now fully formed, and price will now start to fill in the handle. In order to fill the handle, FLARE will have to drop down into the mid .02's range, and do the hokey-pokey for a little while.
Good luck, and always use a stop.


FLARE has now set the boundaries for a potential cup & handle.I posted a previous chart that surmised a potential cup & handle may be attempting to develop. Now that the recent breakout has pulled back, it has given us the ability to determine the height of the cup, and the pullback will also help us to determine the potential depth of the lower trend line on the handle. The white dashed line is my estimate of the general area I believe it could be.
This is a great sign! With the recent bounce we've seen the past 10 days or so, FLARE is now on a lot of people's radar who missed the recent breakout, and are now looking for a potential entry point moving forward. This could give us the volume we need in the coming weeks/months to breakout of the cup & handle pattern, and see even more impressive gains in the near future.
Keep in mind it will take time for this handle to fill in, assuming that the cup & handle will continue to form moving forward, but at this point it's looking highly probable.
Good luck, and always use a stop loss!

FLARE rising like a phoenix? While still getting the airdrops promised over two years ago, Flare is slowly gaining some good stairsteps on its daily chart. The development progress of the chain has been promising and looks to be getting stronger and more valuable with each quarter.
I've been a holder since day one and will continue to hold. This one is going to flip ETH.

FLRUSDT breaking on support levelFLRUSDT breaking on support level with good risk reward ratio for shorting...

FLR - Flare Coin moving upFlare is breaking up the stage 1 on 0.017$ Level, it is a good rise with increasing volumes supporting the trend.If persist we are going towards 0.026 and 0.03 area as possible potential targets
Good Trading
