Hang Seng.....Important decision ahead!Hello Traders,
since my last analysis HS broke out to the upside with a 200 point gap ( I argued this) and made new highs.
The pullback from 27040.41 area, the „breakout high“ is a retest of the support, former resistance level. If HS confirm this level in the coming hours and days and made a new high above the 27040.41 level, we will get a new buy-signal!
As to observe at the graph is the clear „three-down“ from 27040.41 – 26322.68 area (red arrows)! That means, the next degree of trend is to the upside.
So, the important level on the downside is the 26322.68, the upside is 27040.41. Any break of these levels indicate further weakness or more bullish potential in the coming hours and days.
But keep in mind, that HS is now at a critical level (at 26782.62, brown trend line)! This area is important to overcome, too.
If HS is likely to break this area, the next target is the open gap, left by trading from the weekend on Feb. 21-24. This means a close of the gap should bring HS to 27308.81.
Have a great week.....
Ruebennase
Feel free to ask or comment!
Trading this analysis is at your own risk!
HK50 trade ideas

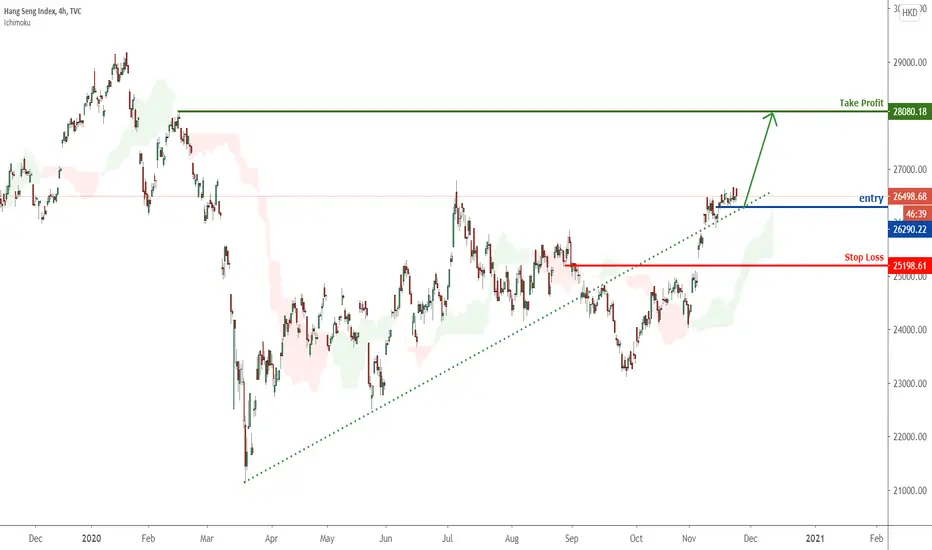
HANGSENG 05122020weekly closed with a struggled candle.
tested support 26.3k and 26.6k
if break and closed above 27k can go to 28k
overall more on bullish bias

Hong Kong stonks Formating descending triangle on the top of the strong trend, possible fall to 26350

HSI 28112020HSI finally broke above 26.6k
support to watch 26.6k , 26.4k
Resistance to watch 27k, 27.4k , 27.8k


HSI bouncing from channel , more upside ! HSI bouncing from channel, more upside ! Stochastics is also showing hidden support level for price to bounce from!


HSI is seeing support from the trendline, more upside ! HSI is seeing support from the trendline, more upside !
Hang Seng.....Next breakout?Hello Traders,
since my last analysis (red arrow) HS-index has broken out to new highs since the low at 23124.25 on September 25. It has moved into a range of resistance (at 26782.62) that pretty cool coincide with the 1.382 Fib-Extension of wave x. And it is the 0.618 Fib.-Extension of waves x and y!
So, multiple resistance lies directly ahead.
And at least, HS also reached the declining trend line that connects the high from January 2018 and April 2019.
It could be that HS will spike above the trend line to touch the areas, mentioned before. Two scenarios are still possible.
It will fail to breakout to new highs and corrective setback is next.
Or it will breakout with a massive gap to the upside (a bullish gap) and this would open the door to 292xx area still!
I will update the count in the coming hours.
Have a great Sunday!
Ruebennase
Feel free to ask or comment!
Trading this analysis is at your own risk!

view on HSI 22112020HSI sideways for weeks within
26k-26.6k..
pending for breakout above 26.6k for further upside.
No game if price break below 26k.


Hong Kong Hang Seng Index New Target 27,000 $HSI We have broke 25 and 26k, next stop is the 200 ma (red line), channel resistance and psychological level of 27k.
Because of how fast we have run in the last couple of days, I do expect us to retrace back to the blue line and even the 50 ma (yellow line) at some stage. It is likely that we retrace back to the these levels before going to 27k.

Hang Seng Index - Better days ahead?The Hang Seng Index has finally broken out of the short-medium term downtrend, as you can see, the market opened out of the channel I have drawn previously and is looking to challenge the 25,700 level. Expectations of a Biden win has led to positive expectations on the future growth prospects of the China/Hong Kong market.
In my opinion, I expect a contested election due to Trump's extremist behaviours. This may represent more uncertainty in the U.S. market; leading to a sell off. And may also act as a tailwind to Hong Kong/China with funds flowing in as a hedge. In the long-run, I am bullish on Hong Kong/China's growth prospects!
Views are my own and should be meant for discussion and educational purposes only. Please make your own investment/trading decisions!


Hongkong 50 may face a pull back?1.If we disregard the wicks, and pull out FIB retracement tool, we can see that HK50 is testing the 0,382 level. We can see that this level acted as support in the middle term and right now it has turned into resistance.
2.A blue wedge has formed on the daily chart, I disregarded the breakout because the resistance have been tested so many times since March. If HK50 break the FIb 38.2 level, I may pay attention to the resistance.
3. What’s more, we can see the daily RSI is coming close to the overbuying zone. When entering the overbuying zone, HK50 usually face a pull back. I pointed them out with yellow circles. Maybe when HK 50 meet the wedge’s resistance, the daily RSI will enter the overbuying zone, and it may pull back to Fib 23.6level or the wedge’s support.

HSI long the pullbackHSI breakout the downtrend channel ....
and form a big gap .
Looking good that money going back to HSI .

HSI being lifted upRead this article and digest it for a while .....
Do you think this trend will continue ? I think so with US coming hard on Chinese Companies that were listed in USA. We have seen how JD.com, Alibaba, Tencent, Netease, etc suffered temporary setback in its share price. We can expect more companies raising additional funds by listing in HK and that means more hot money will be flowing into its share market.
We have seen the Nasdaq of Asia, Isharestech performance here and new players that are queuing to join the IPOs fever will drive the share price higher and higher.
Hopefully, HSI which has been recovering slowly from the March Low will benefit from this wave of hot money coming into Hong Kong. And I do wish there can be a good spread of industries/sectors that are not in the Tech space as well. For example, Nongfu Spring water IPOs was pretty excellent as well.

1 more leg down or has climb already begun?Let's see if the recent downward move has got fuel for another leg.
Already in some longs, but feeling a little off after some analysis.
Will keep current longs but will be hunting at 23600 if it does go there.

HSIHSI looks terrible to be predicted to 20-40% further drop to 179xx and 118xx next year, based on monthly Elliott wave.
Anyway, it will still rebounce based on a short term Elliott wave it has finished from 304xx(Apr 2019) to 211xx( Oct 2020).
The rebounce target maybe 283xx maximumly by 17%.

HSI Hang Seng IH&S PatternWe have a great Inverted Head And Shoulders pattern showing on the HSI-Index.
These patterns have a fairly high accuracy rate, and are one of my favorites.
We measure the height of the pattern and multiply by chances of success for target range,
1726*0.71 (71% chance) = 1225.81 from breakpoint.
Entry: wait one full bar minimum as this pattern confirmed at the very end of the trading session last week.
TP: ~26060
SL: ~24092
R/R: Around 1.5-1.7 depending on entry
Pattern info: thepatternsite.com

