Russell 2000 in the course of reducing the gap from the marketThe Russell 2000 index is in a positive direction and remains about 20% to reach all-time high while S&P 500 and NASDAQ have been in there high regions for some time.
The index looks good at the moment and the market expects cut in interest rates around June, but inflation is still weighing on the move.
As long as no special news is published from the FED, the gap between the small cap stocks and the rest of the market will narrow
don't forget... the only way to trade the stock market... look at my signature below
Otherwise it won't work...
TVC:RUT
US2000 trade ideas

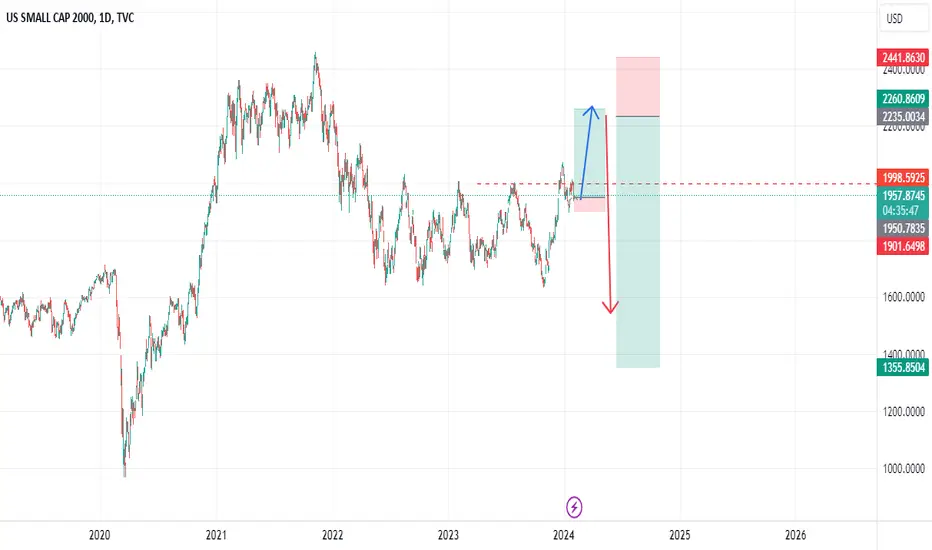
RTY Futures small Short postionPrice will potentially go short before continuing long-term bullish move
Bearish shark pattern Russel 2000Hi Guys,
A potential bearish shark pattern is taking shape and almost at completion/ entry point. Entry level being 88.6 to 1.13 at point D .. I've taken the entry point on the chart as far as the shark pattern will still stay valid...i.e the BD line remaining between 1.618 and 2.24 ( I usually allow +- 0.10 on the fib ratios). Entry point aligns nicely with previous resistance.
Safe trading all

RTY SpeculativeLong 1930 - 1950
Stop losss 1911
Target 2020
Fundamental
-FWD PE 5Y trade at -1SD
-FWD 12M growth 29%
-Laggard play , expect rotation from large cap to mid/small cap
Risk factor
-No rotation with macro risk overwhelming
-Regional bank continue sell off and spark investor fear

Major chart breakout in RussellFollowing the premature breakout of a massive rectangle that lacked follow through in Russell in late December, the rally today appears to be the legitimate breakout. This could be a strong advance.

RUSSEL 2000 - Bullish Pennant - Value Area1. Zoomed out to provide perspective - Long term ranging market with a recent breakout. Now trading close to the previous resistance.
2. Market trading above the 50 and 200 EMAs - bias is to look for long opportunities in value areas.
3. As mentioned in point 1, market trading in a value area. If a long trade goes against us, we'll be able to understand quickly and a cheaply that our idea didn't work out. Conversely, if a long trade goes our way, there's a meaty reward ahead. In short, there's a risk / reward asymmetry presenting itself in this market.
4. Where is the trigger for a long trade?
a) Edge of a pennant pattern with a breakout leaded by an above average size bullish candle.
b) Preceded by another above average sized bullish candle
c) RSI depicts a shift of momentum to bullish.
5. Trade
a) Current daily candle
b) SL below the pennant pattern - $1887
c) TP - follow the trend and close position upon EMAs crossings or aim at the this market's all time highs range.
6. Risk management: No more than 1% of yr total equity at risk.
Cheers

Russel 2000 quick sell??Hi guys,
not much to go into here.
Simple sell at key resistance down to support. Clear stop and TP.

Russell 2000 in precarious positionHi Guys.
I am still bullish biased on the Russel. At the moment the index is being supported by the 50 ma and directly overhead has resistance by the 20 ma. The pullback to the current price is also a retest of the downward trendline it broke out of. Should the Russell make a bullish move from here and clear the most recent swing high that would look like a break of an inverse H&S but I see the more likely scenario of not being able to break the swing high until it moves slightly lower and makes a double bottom on the Daily which I am waiting to trade rather than the HS pattern which I dont like as a continuation pattern.
Also should price move south it may coincide with the completion of a bullish shark pattern with entry starting at the 88.6 level until the 1.13 level, wherever a proper entry reason arises for an individual's trading style/ methodoligies.
A more powerful move would follow a double bottom which has support in the area of the anchored VWAPs (Black and red lines on chart). the from both bear market high and lows which doesnt happen all that often and historically is powerful suport or resistance. You can see the bounce off the black AVWAP and 50 MA when the Russel pulled back from its massive run up from the lows.
We shall see what plays out ove the coming days / weeks.
Safe trading all.

Long Deep OTM Calls on RUT.I have a bunch of limit orders to buy everything lower and would far prefer to buy them lower but all the would be sell signals failed recently on SPX and Nasdaq.
RUT has lagged these heavily over the last while but I think we might be due to see one of the best moves we've seen in RUT for a while. I'd want to short into a spike but for now I am buying 2100 calls for mid/end of March.
I think there's a good chance of a strong rally in the coming weeks.
Potential Breakout in Small Caps The Russell 2000 small cap index has lagged the broader market so far in 2024, but now it may be showing signs of strength.
The first pattern on today’s chart is the lower low and higher high on Monday versus Friday. That kind of bullish outside candle may suggest that buyers are taking control.
Second, prices pushed above a falling trendline from the December 27 peak.
Third, RUT bounced in mid-January slightly above 1888. That was the peak before the Federal Reserve’s dovish meeting on December 13. It was also slightly above a 50 percent retracement of the rally that started on November 14 (when inflation hit 0 percent). Some traders may also view the recent pullback as a completed ABC correction.
Next, the 8-day exponential moving average (EMA) has crossed back above the 21-day EMA. MACD also flipped back to positive. Those points may reflect bullishness in the shorter term.
Turning to the longer run, the 50-day simple moving average (SMA) had a “golden cross” above the 200-day SMA earlier this month. The weekly chart below also shows how RUT has held potential support levels and may be challenging key resistance from August 2022.
TradeStation has, for decades, advanced the trading industry, providing access to stocks, options and futures. See our Overview for more.
Important Information
Past performance, whether actual or indicated by historical tests of strategies, is no guarantee of future performance or success. There is a possibility that you may sustain a loss equal to or greater than your entire investment regardless of which asset class you trade (equities, options, futures or cryptocurrencies); therefore, you should not invest or risk money that you cannot afford to lose. Online trading is not suitable for all investors. View the document titled Characteristics and Risks of Standardized Options at www.TradeStation.com . Before trading any asset class, customers must read the relevant risk disclosure statements on www.TradeStation.com . System access and trade placement and execution may be delayed or fail due to market volatility and volume, quote delays, system and software errors, Internet traffic, outages and other factors.
Securities and futures trading is offered to self-directed customers by TradeStation Securities, Inc., a broker-dealer registered with the Securities and Exchange Commission (“SEC”) and a futures commission merchant licensed with the Commodity Futures Trading Commission (“CFTC”). TradeStation Securities is a member of the Financial Industry Regulatory Authority, the National Futures Association (“NFA”), and a number of exchanges. TradeStation Crypto, Inc. offers to self-directed investors and traders cryptocurrency brokerage services under federal and state money services business/money-transmitter and similar registrations and licenses.
TradeStation Securities, Inc., TradeStation Crypto, Inc., and TradeStation Technologies, Inc. are each wholly owned subsidiaries of TradeStation Group, Inc., all operating, and providing products and services, under the TradeStation brand and trademark. TradeStation Crypto, Inc. offers to self-directed investors and traders cryptocurrency brokerage services. It is neither licensed with the SEC or the CFTC nor is it a member of NFA. When applying for, or purchasing, accounts, subscriptions, products and services, it is important that you know which company you will be dealing with. Visit www.TradeStation.com for further important information explaining what this means.

Russell showing whos in controlHi guys,
Just additional info on Russel 200 that some may find useful
I was pointing out the control buyers have at the moment on this index.
Further on that, it is the first time that Russell has pulled back from the range high that it has been at for over a year and made an impulsive move to the upside and not down. Also the clear support on the pullback from the anchored vwaps from both the bear market high and low converge to support price at the pullback as well as the 50ma and the gap below not filled.
As I mentioned before two levels of interest where some excellent selling opportunities may arise are the two order blocks ive highlighted that have confluence with fib levels.
Hope some of this info is useful .
Safe trading all.

Russel leaving no doubt Bulls are in total controlRegardless of macro environment or whatever else the price action on the Russel 2000 chart is a warning ... DONT short the indices YET... they still have some way to go.
Bullish pennant after bullish pennant in the move up from the bottom should leave no doubt in anyones mind.
A copy and paste of the flagpole of the large pennant puts the target just below its all time high.
Ive found through backtesting they are incredibly accurate for a gauging profit targets.
This is not to say that there wont be selling opportunities along the way.. in fact there is a daily order block just above its recent high where sellers will likely step in and further up an untested Weekly order block and they both align with fib ratios from the high to the low.

Russell ready to rocketThis is the most asymmetrical reward to risk trade I see right now of all the markets I follow. As I do the math, there is a potential reward of $10 for every $1 of risk. I dream of set ups like this. Of course, that does not mean it will be a winner. TVC:RUT $M2K_F

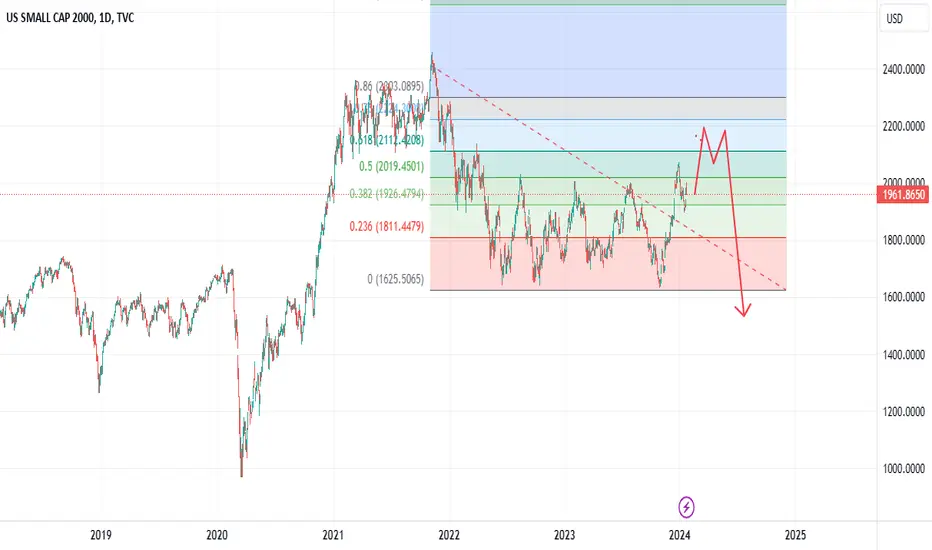
RUSSEL 2000 ready for an explosive move?RUT has created an interesting daily price chart:
1. it shows a pole/flag pattern with a potential to move another step upwards - but how much?
2. it shows an inverted Shoulder-Head-Shoulder pattern, which points to a potential move - eventually erractic ? - towards 2100 points.
3. the cyclical pattern let us expect a feelable trough only towards end of February.
Though, many see the RUT as weakest among the indexes, but expect the unexpected......

$RUT - Caution. Watch for the Bear 'Flag' to play out...An Overthrow of a slanted Bear 'Flag which would be hugely bearish as has the potential for a large C-Wave to unfold.

breakout to fail and create double top?adding together the indices to create this index combo chart of naz spx and russell to get a nice big picture view.
can the economy support high growth to justify this implied stock growth premium?
momentum in indicators could be waning.

US2000 Horizontal Range PlayPrice has been trading inside of a horizontal range for some time now. On the previous run up to resistance there was a range breakout that quickly fell back inside the range, more than likely trapping those who bought the breakout. The 2000 price level is now potentially serving as an important barrier just under range resistance. If this area continues to hold, then I expect an eventual move towards and possibly down to 1640, which is range support.

RUT Possible Range Based Bull TrapWhile everything else put in really big rallies RUT has lagged and acted a lot more consistently with a classic bull trap pattern.
I continue to think the weakness in the RUT is sus, because in theory small caps should be stronger into the early section of a bull market.
Probably a spike to come. Likely a fast one. Maybe a good time to be long OTM calls, but the ideal things for a bear setup here would be a spike out of the range, a hit of the 76 retracement and then the downtrend starting.
Would be really interested in shorting a RUT pop here.
US2000 Short with Caution:: Fundamentally S&P, DOW, and NAS have broken the all-time high while Russell is at -20% from the previous high because RUSSELL is low cap index and they suffers when the interest rate is high -- RUSSELL is waiting for the NEXT rate cut to RUN above the existing zone (which is by the end of Jan and March. It seems that there will not be a rate cut in JAN).
PRICE ACTION
:: Monthly price (rising) above the baseline of TDI.
:: Weekly retesting of the baseline of TDI
Price reversed after an inverted hammer followed by a strong bearish close. However, Doji is followed by Hammer BUT they are not at the significant zone (high or low position of the trend) to expect the reversal.
:: Daily Price is still below the previous swing low.
Got to wait till W or divergence formation in TDI for a buying opportunity
4th attempt to break the consolidation but failed.
:: 4H at previous swing low (perfect zone to reverse and make new low)
Price at a minor trendline and should not have a sustained close above.
SK SYSTEM
After a complete sequence at 2461, the price tested the 1460-1710 B zone and has respected this zone since June 2022.
The sequence that started from Oct-2023 has completed its full sequence by closing higher than the previous three highs (accumulation price high).
After the completion of a sequence, we expect the retest to the WCL level which is the TP1 Zone;
Hence, I am looking for a SHORT opportunity as a correction move BUT if the price closes above 1987 I will look for a buy Opportunity.
TP2 doesn't seem to be appropriate as if the price has to attempt a bullish, price should not come back to the TP2 zone which is the consolidation low area.

US2000 H4 | Downward trend to resumeUS2000 is rising towards a pullback resistance and could potentially reverse off this level to drop towards our take-profit target.
Entry: 1,944.21
Why we like it:
There is a pullback resistance that aligns close to the 23.6% Fibonacci retracement level
Stop Loss: 1,988.39
Why we like it:
There is a pullback resistance that aligns with the 50.0% Fibonacci retracement level
Take Profit: 1,874.74
Why we like it:
There is a pullback support that aligns close to the 61.8% Fibonacci retracement level
Please be advised that the information presented on TradingView is provided to Vantage (‘Vantage Global Limited’, ‘we’) by a third-party provider (‘Everest Fortune Group’). Please be reminded that you are solely responsible for the trading decisions on your account. There is a very high degree of risk involved in trading. Any information and/or content is intended entirely for research, educational and informational purposes only and does not constitute investment or consultation advice or investment strategy. The information is not tailored to the investment needs of any specific person and therefore does not involve a consideration of any of the investment objectives, financial situation or needs of any viewer that may receive it. Kindly also note that past performance is not a reliable indicator of future results. Actual results may differ materially from those anticipated in forward-looking or past performance statements. We assume no liability as to the accuracy or completeness of any of the information and/or content provided herein and the Company cannot be held responsible for any omission, mistake nor for any loss or damage including without limitation to any loss of profit which may arise from reliance on any information supplied by Everest Fortune Group.

Will US2000 find buyers at market?US2000 - 24h expiry
Although the bears are in control, the stalling negative momentum indicates a turnaround is possible.
We are trading at oversold extremes.
This is positive for short term sentiment and we look to set longs at good risk/reward levels for a further correction higher.
Previous support located at 1924. Preferred trade is to buy on dips.
We look to Buy at 1925 (stop at 1905)
Our profit targets will be 1975 and 2010
Resistance: 2010 / 2080 / 2110
Support: 1865 / 1820 / 1775
Risk Disclaimer
The trade ideas beyond this page are for informational purposes only and do not constitute investment advice or a solicitation to trade. This information is provided by Signal Centre, a third-party unaffiliated with OANDA, and is intended for general circulation only. OANDA does not guarantee the accuracy of this information and assumes no responsibilities for the information provided by the third party. The information does not take into account the specific investment objectives, financial situation, or particular needs of any particular person. You should take into account your specific investment objectives, financial situation, and particular needs before making a commitment to trade, including seeking advice from an independent financial adviser regarding the suitability of the investment, under a separate engagement, as you deem fit.
You accept that you assume all risks in independently viewing the contents and selecting a chosen strategy.
Where the research is distributed in Singapore to a person who is not an Accredited Investor, Expert Investor or an Institutional Investor, Oanda Asia Pacific Pte Ltd (“OAP“) accepts legal responsibility for the contents of the report to such persons only to the extent required by law. Singapore customers should contact OAP at 6579 8289 for matters arising from, or in connection with, the information/research distributed.

big down side, small upside in RUTRusell 2000 maybe leading the rest of the market to the downside.
Russell has exposure to financial and energy, more so than nasdaq and large cap sp500.
MMFI- is the percentage of stocks over the 50 day moving average. Useful in indicating how broadly bullish or bearish the market is, how the crowd is leaning in sentiment.
VIX- is volatility index which measure options premium for 30 days and annualizes number, also known as fear indicator and is useful in measuring expected movement and uncertainty by traders.
While price has been rising in sp500, could RUT russell2k be signaling a turn coming in profit taking or more.
Trade Idea- bear spreads for 6 months out or more, profit taking , asset allocation rebalancing.
*Not advice, just what I'm doing and thinking for me

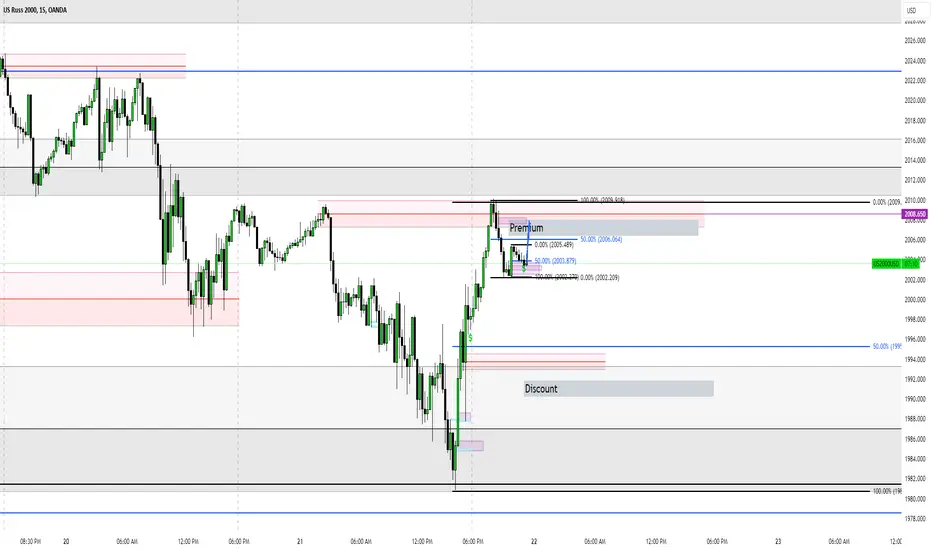
US2000 H4 | Potential bearish reversalUS2000 could rise towards a pullback resistance and potentially reverse off this level to drop lower.
Sell entry is at 1,987.83 which is a pullback resistance.
Stop loss is at 2,024.47 which is a pullback resistance that sits above the 61.8% Fibonacci retracement.
Take profit is at 1,923.50 which is a pullback support.
High Risk Investment Warning
Trading Forex/CFDs on margin carries a high level of risk and may not be suitable for all investors. Leverage can work against you.
Stratos Markets Limited (www.fxcm.com):
CFDs are complex instruments and come with a high risk of losing money rapidly due to leverage. 67% of retail investor accounts lose money when trading CFDs with this provider. You should consider whether you understand how CFDs work and whether you can afford to take the high risk of losing your money.
Stratos Europe Ltd, previously FXCM EU Ltd (www.fxcm.com):
CFDs are complex instruments and come with a high risk of losing money rapidly due to leverage. 72% of retail investor accounts lose money when trading CFDs with this provider. You should consider whether you understand how CFDs work and whether you can afford to take the high risk of losing your money.
Stratos Trading Pty. Limited (www.fxcm.com):
Trading FX/CFDs carries significant risks. FXCM AU (AFSL 309763), please read the Financial Services Guide, Product Disclosure Statement, Target Market Determination and Terms of Business at www.fxcm.com
Stratos Global LLC (www.fxcm.com):
Losses can exceed deposits.
Please be advised that the information presented on TradingView is provided to FXCM (‘Company’, ‘we’) by a third-party provider (‘TFA Global Pte Ltd’). Please be reminded that you are solely responsible for the trading decisions on your account. There is a very high degree of risk involved in trading. Any information and/or content is intended entirely for research, educational and informational purposes only and does not constitute investment or consultation advice or investment strategy. The information is not tailored to the investment needs of any specific person and therefore does not involve a consideration of any of the investment objectives, financial situation or needs of any viewer that may receive it. Kindly also note that past performance is not a reliable indicator of future results. Actual results may differ materially from those anticipated in forward-looking or past performance statements. We assume no liability as to the accuracy or completeness of any of the information and/or content provided herein and the Company cannot be held responsible for any omission, mistake nor for any loss or damage including without limitation to any loss of profit which may arise from reliance on any information supplied by TFA Global Pte Ltd.
The speaker(s) is neither an employee, agent nor representative of FXCM and is therefore acting independently. The opinions given are their own, constitute general market commentary, and do not constitute the opinion or advice of FXCM or any form of personal or investment advice. FXCM neither endorses nor guarantees offerings of third party speakers, nor is FXCM responsible for the content, veracity or opinions of third-party speakers, presenters or participants.
