RUSSELL 2000 Spearheading the next stock market run?Russell 2000 / RUT closed the 3rd green day after hitting the Support A Zone that is holding since June 16th 2022.
This is turning into a major long term buy signal and will be validated when tomorrow the 1day MACD forms the lowest Bullish Cross since March.
Technically the bullish break out happens after the price crosses over the 1day MA50, but on a broader horizon, the current level is low enough to attempt a buy.
Target 2000 (bottom of Resistance Zone A).
Follow us, like the idea and leave a comment below!!
US2000 trade ideas

Russell pried in goldThe vice is tightening.
notes:
this line lost
one more rally?
#stocks #banks #spx #inflation #gold #silver

Russell priced in silverThat looks like a massive double top for US small cap stocks priced in silver.
Who is betting against this?
#silver #purchasingpower #gold #inflation #stocks

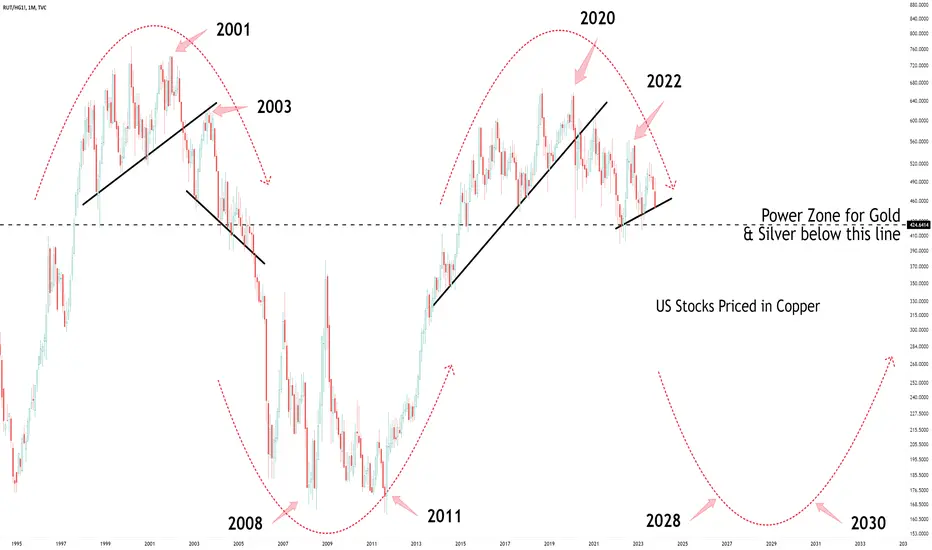
Russell priced in CopperHow can this be bullish for US equities?
Very close to full melt down.
Expect #gold and #silver to out perform when this happens.
#copper #stocks #gold #silver #uranium #crudeoil
Russell 2000 Roadmap Oct 2023C wave underway now. Early stages but likely to be more complex and prolonged into 2025

russell priced in goldHow can there be a SECULAR BULL market for US stocks if this happens?
By the way, US stocks (priced in gold) STILL below their 2000 highs.
Macro capital flow rotation still underway.
#gold #silver #crudeoil #uranium

RUSSELL 2000 Support Zone rebound?Russell 2000 (RUT) entered on Friday the wide Support Zone (1700 - 1630) that was formed on the May 12 2022 Low. The 1D candle closed inside it so unlike the bottoms that had wicks that recovered and closed above the Zone, this is most likely similar to the June 16 2022 and September 23 2022 breaches.
A low is to be expected around 1640 but the index is already a strong long-term buy, as the cyclical behavior of the Sine Waves suggests. The tops match perfectly with the Waves. In any case, from now on the first sign of 1D RSI Higher Lows (Bullish Divergence if the candles are on Lower Lows), will be the last confirmation we need of an upcoming bullish leg, which was the characteristic of all previous 3 bottoms.
On top of that, 10 days ago a 1D Death Cross was formed and even though that's a technical bearish pattern, last time it signalled the bottom. Our target is 2000, just below the 2008 - 2027 Resistance Zone.
-------------------------------------------------------------------------------
** Please LIKE 👍, FOLLOW ✅, SHARE 🙌 and COMMENT ✍ if you enjoy this idea! Also share your ideas and charts in the comments section below! This is best way to keep it relevant, support us, keep the content here free and allow the idea to reach as many people as possible. **
-------------------------------------------------------------------------------
💸💸💸💸💸💸
👇 👇 👇 👇 👇 👇

if interest rate keep around 6% for 1 year, big cap or small capif the FED stop increase the interest rate and keep the rate around 6% for about one year, do you think the small cap companies will suffer so much and can recover until the FED start to decrease the rate?

RUSSELL 2000 HAS A NEW TECHNICAL FORMATIONRUSSELL 2000 has formed a bearish pennant formation.
Meaning, the target for shorts are 1630-1650 range.
Russell 2000 going down is not a good news for other big indices either.
-Signalwyse Team

Short Russell 2000If you aren't already short from higher (I am) then decent risk/reward set-up right here.
Sell 1750, stop 1775, target sub 1700 ideally 1650 test in the next couple of weeks.

Russell Priced in GoldYES, I'll post as many bullish road maps for silver as I want!
Check out what happens to silver when Russell breaks down versus gold...
Russell is weak.. very weak.
#gold #silver #evidence #inflation #spx #nasdaq

Why is Dow Jones leading Nasdaq and S&P this time?Why is Dow Jones a better indicator to measure the coming recession?
Reference for trading:
E-mini Nasdaq Futures & Options
Minimum fluctuation
0.25 index points = $5
Micro E-mini Nasdaq Futures & Options
Minimum fluctuation
0.25 index points = $0.50
Disclaimer:
• What presented here is not a recommendation, please consult your licensed broker.
• Our mission is to create lateral thinking skills for every investor and trader, knowing when to take a calculated risk with market uncertainty and a bolder risk when opportunity arises.
CME Real-time Market Data help identify trading set-ups in real-time and express my market views. If you have futures in your trading portfolio, you can check out on CME Group data plans available that suit your trading needs www.tradingview.com

What Pitchfork Says About Russellthe detail is shown in the above Idea.
I made this Idea based on Candlestick Analysis and Pitchfork Tool.
This chart beautifully shows the Russell support and resistance and Trend lines
golden line : level 0.61.8 1.618 ....
green line : level 0.382 ...
black line : level 1 2 ...

RUT/NDX ratio tells you to keep investing in tech!Something a little different today.
Was looking a some stock ratios and decided to regress the standard Russell 2000 against the risky technology index, the Nasdaq.
This RUT/NDX ratio has been inside a Channel Down since the Dotcom Bubble send it sky high, collapsing the tech sector.
The Channel Down has never been broken since and made a new Low this month.
What does this tell you? Keep investing in tech!
Follow us, like the idea and leave a comment below!!

RUSSELL 2000 Holding the key Bull Cycle Support. Disaster below?Russell 200 (RUT) has had a big safeguard on the current Bull Cycle following the Housing Crisis bottom in 2009. The symmetrical Zone that was formed on the previous All Time High (ATH) has always held once it transitioned into Support upon periods of corrections (with the natural exception of COVID) and provided the framework for the rebound initiation of the next rally.
This time the previous ATH Zone has been continuously tested since May 2022 and so far has closed all candles above it. October has already entered this Support Zone with the 1M MA100 (green trend-line) right below it and the longer it holds, the sooner it will also enter the Zone. When the 1M MA100 broke during the COVID collapse, the flash crash extended almost as low as the 1M MA200 (orange trend-line).
Naturally the market conditions now are severely different than then, but the Support Zone must hold at all costs. If it breaks, the distress signal that will send may echo across high cap markets, especially the technology sector.
-------------------------------------------------------------------------------
** Please LIKE 👍, FOLLOW ✅, SHARE 🙌 and COMMENT ✍ if you enjoy this idea! Also share your ideas and charts in the comments section below! This is best way to keep it relevant, support us, keep the content here free and allow the idea to reach as many people as possible. **
-------------------------------------------------------------------------------
💸💸💸💸💸💸
👇 👇 👇 👇 👇 👇

Unfavorable outlook for US stocks priced in Silver. #silver #spUnfavorable outlook for US stocks priced in Silver.
bull era for gold, silver, crudeoil and uranium
#silver #spx #rut #iwm #inflation #recession

US Stocks in very DANGEROUS situation.I would NOT want to be long right now...
VERY similar setup to previous HEAVY drops in US Stocks.
You have been warned.
#spx #ndx #rut #djia #silver #gold #recession #dxy

HEAD & SHOULDERSSloping neckline noted. Not all necklines are straight.
This pattern often occurs at or close to a top.
The neckline is support until broken.
This pattern consist of 2 shoulders with the both shoulders having price in the same ballpark. Rarely do the shoulders share the exact same price. They should be relatively equidistant from the head which is a higher peak than either shoulder and is in the middle of the 2 shoulders.
The pattern is not valid until the neckline is broken with a downtrend.
Short if the neckline is broken but retests are common. Once the neckline is broken, it becomes resistance.
No recommendation

Small Caps Are Leading to the DownsideIndexes of big companies like the S&P 500 and Nasdaq-100 neared record highs in July, but not the small cap Russell 2000. Today we’ll use a weekly chart to consider how it’s leading to the downside.
The first pattern is the series of lower highs starting in August 2022. RUT unsuccessfully tested that area in January and again in July, which could suggest it’s become resistance.
The price action is noteworthy because SPX and NDX both cleared those respective levels from the summer of 2022. With relative strength already negative, will the weak get weaker?
Second, the 1650 area was resistance in late 2020. RUT bounced there in June 2022 and again last October. Traders may now view that level as a downside target.
Third, consider the macro environment. Some strategists have recently noted that small caps are more vulnerable to rising interest rates (unlike bigger companies that locked in long-term financing at lower rates). They’re also more associated with risk appetite because of their focus on industrials and financials. That could increase their difficulties if volatility increases further.
TradeStation has, for decades, advanced the trading industry, providing access to stocks, options, futures and cryptocurrencies. See our Overview for more.
Important Information
TradeStation Securities, Inc., TradeStation Crypto, Inc., and TradeStation Technologies, Inc. are each wholly owned subsidiaries of TradeStation Group, Inc., all operating, and providing products and services, under the TradeStation brand and trademark. TradeStation Crypto, Inc. offers to self-directed investors and traders cryptocurrency brokerage services. It is neither licensed with the SEC or the CFTC nor is it a Member of NFA. When applying for, or purchasing, accounts, subscriptions, products, and services, it is important that you know which company you will be dealing with. Please click here for further important information explaining what this means.
This content is for informational and educational purposes only. This is not a recommendation regarding any investment or investment strategy. Any opinions expressed herein are those of the author and do not represent the views or opinions of TradeStation or any of its affiliates.
Investing involves risks. Past performance, whether actual or indicated by historical tests of strategies, is no guarantee of future performance or success. There is a possibility that you may sustain a loss equal to or greater than your entire investment regardless of which asset class you trade (equities, options, futures, or digital assets); therefore, you should not invest or risk money that you cannot afford to lose. Before trading any asset class, first read the relevant risk disclosure statements on the Important Documents page, found here: www.tradestation.com .


Russell 2000 (RTY) Bearish Sequence Favors DownsideRusell (RTY) shows a 3 swing from July 31, 2023 high favoring further downside to reach equal legs target. It breaks below August 25 low confirming the idea. The drop from July 31 high is unfolding as a zig zag correction Elliott Wave structure. Down from July 31 high, wave A ended at 1832.80 and wave B corrective rally ended at 1934. Wave C lower is currently in progress as a 5 waves impulse structure. The Index has broken below wave A at 1832.8 confirming the next leg lower has started.
Down from wave B, wave ((i)) completed at 1849.40. A flat wave ((ii)) ended at 1892.70. The 1 hour chart below shows the wave ((ii)) starting point. Index then resumed lower in wave ((iii)) ending at 1780.40. Currently, the market is developing wave ((iv)); therefore, we expect a corrective rally in 3, 7 or 11 swing before it resumes to the downside in wave ((v)) of C. Near term, as far as pivot at 1892.84 high stays intact, expect rally to fail in 3, 7, or 11 swing for further downside. Potential target lower is 100% – 161.8% Fibonacci extension of wave A. This area comes at 1705 – 1749.

RTY RUT Russell2000I can see a cascading move lower in the small cap index over the coming months down to the 1500 area possibly by year end or early 2024.

US2000: Thoughts and AnalysisToday's focus: US2000
Pattern – Descending Triangle Pattern
Support – 1840
Resistance – 1870
Thanks for checking out today’s update. Today, we have run over US2000, breaking down the overall price picture, levels, and patterns and incorporating moving average and RSI into the analysis.
The Russel isn’t a market I normally watch or trade, but the descending triangle pattern did catch my eye today. Overall price sits in a range, but it has broken a trend on the inside and set up a LH. These patterns are normally seen as bearish after a trend break, but support looks rather firm at this stage.
With the FOMC coming up later this week, watch out for a false breakout lower that closes higher. This could set up a higher breakout. If sellers continue to push at support, look for a solid close-through support with a new failed rally that sets a new weekly low.
It’s going to be interesting to see which side gets the win here.
Have a great day and good trading.
