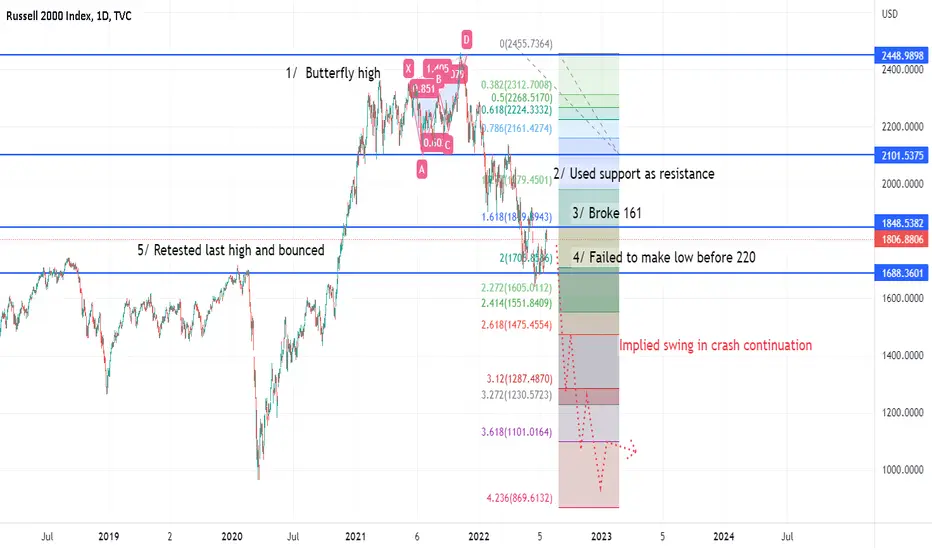
The RUT's textbook crash (So far). RUT has had multiple textbook crash patterns to date and if that continues we're going to soon see a capitulation period. Let's look at the markers of a break we have so far.
1/ The butterfly is a common topping pattern which usually forms when price rallies to ATH, has a sharp sell-off and then ranges for a long time. RUT formed this through 2021 and then the final spike of it came into the end of the year when the RUT started to reverse.
2/ After the initial drop we got under the support base that had held all of 2021. Which seems significant. A level holding price for a year is always liable to give us useful info later, and in this case the info we got was when it retested price was pushed away from it. What was once support is now resistance. To put this in an easier to understand why - what traders treated as cheap in 2021 they treated as expensive in 2022.
3/ The 161 break. After the rejection of the year range the 161 was always quite likely to hit but these do not break very often. The breaking of this level I think was significant. A breaking of a big 161 often signals the start of real market crashes.
4/ The market failed to hold before 220 fib. Which usually confirms a real breaking of the 161. Pullbacks are common but a reversal here is less likely. In downtrend continuation we just retest previous fib levels and then head lower to the next fib levels.
5/ A common marker I've noticed in a market break is we hit the obvious support level, have a bounce on that level and when you look at past crashes objectively it's easy to see this is an area where it'd look a lot like a low might be in. And many lows are actually made on supports like this, but in the times these dead-cat and break this is often a sign of complete bull trend failure. Capitulation comes next. Day after day, week after week the market is lower and lower.
A breaking of the last big lows would be the confirmation signal for the bearish breakout as per historic norms.
US2000 trade ideas
RUT Playing out as expected (expect mini rally)Last year I posted a contrarian view on RUT, although it took a while to play out. I am expecting a mini rally before we sell off for the A wave to complete.
Please do your DD as this is not an investment advise.

US2000USD $US2000USD Long ScalpUS2000USD $US2000USD Long Scalp. TPs on chart, 10-50X leverage. No SL.

Long RUT I think my thesis for the short at this level is failing in indices with them all looking really strong intraday and trading above the stop loss zones for my shorts. Often I find these create big squeeze scenarios in which we consistently hold higher lows. Looking for bull entries into dips now.
Could be a good strong trend if we make new highs here. Probably sets the trend for the rest of the week, at least.

US2000 - SHORTBEARISH STRUCTURE
LH, LLs
Bearish engulfing candle at LH
Entry: 1712.53
SL: 1715.60
at Daily resistance
after rejection, it will go to H support

Joe Gun2Head Trade - Short term bottom on Russell2000?Trade Idea: Selling EURJPY
Reasoning: EURJPY to continue lower? Broken trend and EUR under pressure
Entry Level: 1752
Take Profit Level: 1794
Stop Loss: 1741.5
Risk/Reward: 4.15:1
Disclaimer – Signal Centre. Please be reminded – you alone are responsible for your trading – both gains and losses. There is a very high degree of risk involved in trading. The technical analysis , like all indicators, strategies, columns, articles and other features accessible on/though this site is for informational purposes only and should not be construed as investment advice by you. Your use of the technical analysis , as would also your use of all mentioned indicators, strategies, columns, articles and all other features, is entirely at your own risk and it is your sole responsibility to evaluate the accuracy, completeness and usefulness (including suitability) of the information. You should assess the risk of any trade with your financial adviser and make your own independent decision(s) regarding any tradable products which may be the subject matter of the technical analysis or any of the said indicators, strategies, columns, articles and all other features.

RUT 1M V1 FUNThe Russell 2000 Index is a small-cap stock market index that makes up the smallest 2,000 stocks in the Russell 3000 Index . It was started by the Frank Russell Company in 1984. The index is maintained by FTSE Russell, a subsidiary of the London Stock Exchange Group.

US2000 Daily Outlook | June 30Holla,
My love for this pair is yet to be measured. It moves at the same time with NAS100, US30, Ger30, US500, but there is something about it that hit me so hard.
You will find out during my live trading session today
See you at 8:45AM EST (mon-fri)
Kings

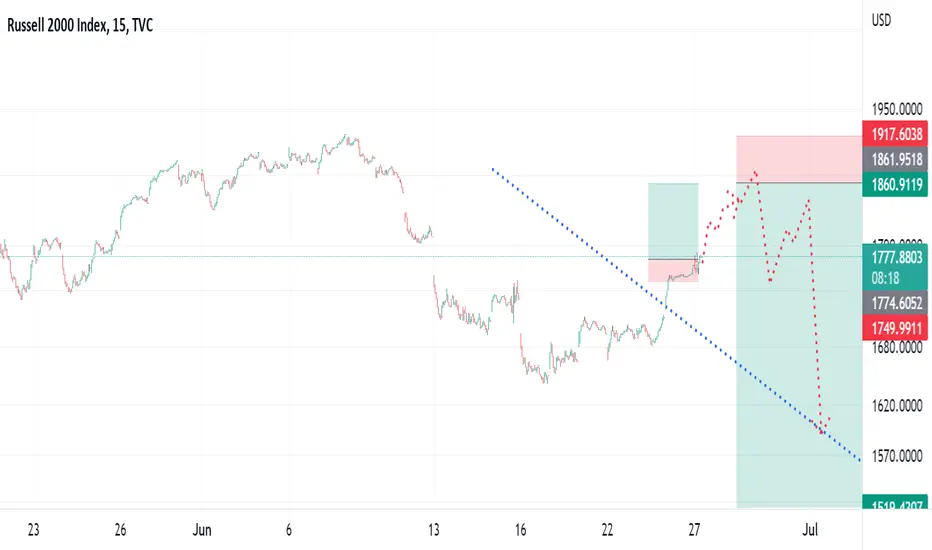
RUT long into short positions Positioning for a big whipsaw style move in the RUT.
Similar to SPX trade plan.
$RUT Canary in the Coal MineThe Russell 2k tends to be a solid indicator of broader market movement.
While we have realized a correction of ~33%, given the broader macro headwinds... this is not nearly the level expected relative to past major corrections (dot.com & housing market).
Given the past major corrections of 47% and 60%, not including the global pandemic shutdown it's apparent theres further markdown market behavior ahead.
At the least, expecting a pullback to the 100 EMA is minimum expected while pullback to the 200 EMA with a further wick down from there is not outside of reason.
The Fed has only recently begun QT with Central Bank balance sheets letting securities roll off as they mature.
With the Fed hyper-focused on inflation with demand side tools at their disposal, the bearish case remains firmly in place right now.
In addition to rates, unemployment is part of the Fed's dual mandate. Given the sheer # of available jobs (2 jobs for each unemployed person in the US), the Fed has plenty of room to focus on reigning in inflation to achieve price stability.
Will there be bear market rallies? Yes.
Will the Fed pivot? Possibly... especially given mid-term elections this fall.
Q2 closes next week, earnings will start pouring in... until the Fed changes narrative and there's substantive change, principal preservation should be the priority with a risk-off focus unless one is highly skilled at trading during extreme volatility.

US2000 has more room to fall !!RUSS2000
Intraday
We look to Sell at 1699 (stop at 1714)
We look for a temporary move higher. Risk/Reward would be poor to call a sell from current levels. The bias is still for lower levels and we look for any gains to be limited. Previous resistance located at 1700. Expect trading to remain mixed and volatile.
Our profit targets will be 1645 and 1605
Resistance: 1700 / 1750 / 1945
Support: 1640 / 1470 / 1200
Please be advised that the information presented on TradingView is provided to Vantage (‘Vantage Global Limited’, ‘we’) by a third-party provider (‘Signal Centre’). Please be reminded that you are solely responsible for the trading decisions on your account. There is a very high degree of risk involved in trading. Any information and/or content is intended entirely for research, educational and informational purposes only and does not constitute investment or consultation advice or investment strategy. The information is not tailored to the investment needs of any specific person and therefore does not involve a consideration of any of the investment objectives, financial situation or needs of any viewer that may receive it. Kindly also note that past performance is not a reliable indicator of future results. Actual results may differ materially from those anticipated in forward-looking or past performance statements. We assume no liability as to the accuracy or completeness of any of the information and/or content provided herein and the Company cannot be held responsible for any omission, mistake nor for any loss or damage including without limitation to any loss of profit which may arise from reliance on any information supplied by Signal Centre.


US2000 LONGThis level is a good level for stopping the present sell of in the US market. Price and Time go together!
I will watch very carefully this levels for new buy opportunities!

$IWM very attractive relative to S&P 500 (5/5)Shall cap relative performance to Large cap is showing a great opportunity.
REcently we have also seen the small caps valuation is as low as GFC levels, which is another indicator of good long-term buy opportunity.
Small caps (IWM) performance to self is not quite as attractive, so be aware. This could simply be an opportunity to do a long-short spread between small caps and large caps.
RSI is not quite as attractive as 2020 bottom, but nonetheless a good place to start adding.

RUT short Looks like the rallies will fail to follow through.
If a dump off a shallow rally like this, it can be super nasty.

CRYPTO MARKET UPDATE!!!!Hi Snipers,
Please refer to the recording for the next price levels and scenarios.
Thanks
MS

CRYPTO MARKET UPDATE!!!!Hi Snipers,
Please refer to the recording for the next price levels and scenarios.
Thanks
MS


RUSSELL 2000 - ELLIOTT WAVE CORRECTION The price is in corrective move. We can expect further downside move if the price doesn't reach the invalidation level. Which will change the wave count. So, this is only for educational purpose.

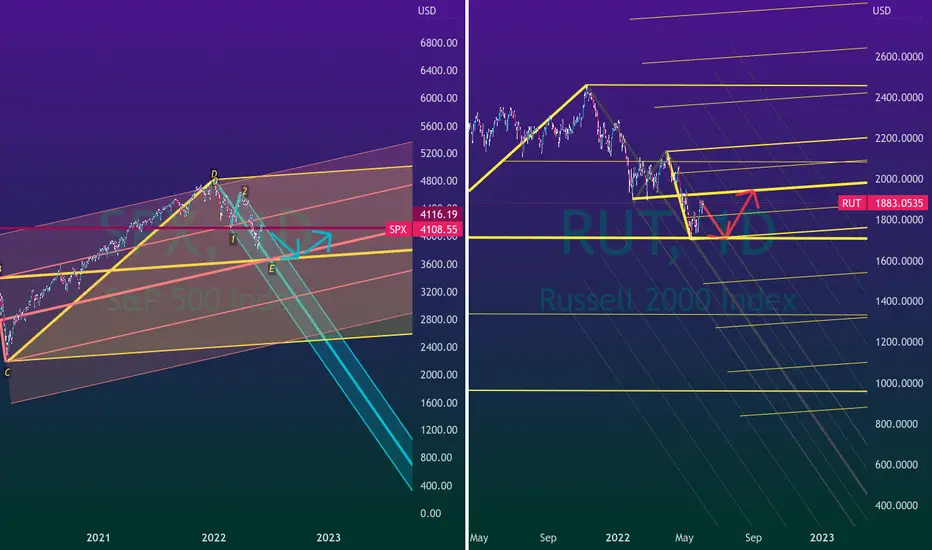
SPX vs RUTfollowing on from the last couple of ideas
rut looks bottomy
spx does not
overall i think we can expect a fast down and up
after that still not sure
of the two i'd take rut tho after the next move down
NOT TARDING ADVICE
GRI 2022
RUT BOTTOM AT 1700Looks like RUT has bottomed
I expect it to test it again tho
Would rather be long this than the other indices
Not trading advice
GRI 2022
Chart: major fork pre and post corona, local fork, inside fork off more distant major pivots...

US2K shortlooking for a short position on US2K down to take out the swing low. Will look for confirm on the 1 min tf
