FORMUSDT Forming Bullish WaveFORMUSDT is currently shaping a bullish wave pattern, signaling a potential upward continuation in price. This technical structure is typically characterized by impulsive moves followed by brief consolidations, suggesting growing investor confidence. The pair has recently shown strength with higher lows and steady volume increases, confirming that accumulation may be underway. Traders watching this pattern should note the supportive technical foundation forming at current price levels.
The projected gain for FORMUSDT ranges from 40% to 50%, supported by positive volume dynamics and increased market interest. The breakout potential from this bullish wave setup is significant, especially as the market begins to rotate capital back into promising low-cap altcoins. With momentum indicators trending upward and no immediate resistance overhead, this setup offers a strong opportunity for medium-term growth.
Investor sentiment around FORM is improving as the project gains visibility within the DeFi and Web3 sectors. The team behind FORM has been steadily building infrastructure that supports yield generation, DAO participation, and cross-chain functionality—all of which align with broader crypto market trends. These factors are drawing attention from both retail and strategic investors looking for next-wave DeFi plays.
As FORMUSDT builds this bullish structure, market participants should keep a close eye on price action and volume for continuation signals. A clean breakout backed by rising volume could validate the projected gains and initiate the next leg higher in this bullish cycle.
✅ Show your support by hitting the like button and
✅ Leaving a comment below! (What is You opinion about this Coin)
Your feedback and engagement keep me inspired to share more insightful market analysis with you!
FORMUSDT trade ideas

$FORM/USDT Breakout.$FORM/USDT just reclaimed a key demand zone after a breakout below the trendline.
The strong bullish candle signals a possible reversal, with upside potential toward $3.4456.
As long as the price holds above $2.6072–$2.7054, bulls are in control. MACD also hints at a momentum shift.
DYRO, NFA

FORM/USDT Analysis: Another Growth Wave Possible
For this token, abnormal buying by a large player has been visible for several days, followed by strong moves with very low volume.
One of these zones is $2.77–$2.74. We consider buying from this zone if a reaction appears.
This publication is not financial advice.

FORM/USDT – A Classic Breakout in Play
Date: May 13, 2025
FORM is finally breaking free from its long consolidation. After a textbook accumulation phase, we’re seeing a clean breakout above the $2.75 horizontal resistance, supported by rising volume and a strong RSI push into overbought territory.
📊 Technical Snapshot:
Breakout Level: $2.75 – now flipped from resistance to support.
EMA Alignment: Price is riding the 4EMA (black) with the green MA catching up, signaling strong short-term momentum.
Volume Surge: Increased buy volume confirms breakout interest.
📈 Entry Ideas:
Breakout entry: Current price zone around $2.83.
Retest entry: On a pullback to the breakout level ($2.70–$2.75) for confirmation and safer risk management.
🧷 Validation:
Setup remains valid as long as price holds above the $2.60 area.
A close below that would re-enter previous range and weaken bullish structure.
🎯 Target Zones:
TP1: $3.89 – previous structural resistance and measured move from consolidation.
TP2: $4.07 – psychological round number + upper liquidity level.
TP3: $5.00 zone – ambitious but realistic if momentum continues and volume expands.
📈 RSI Check: Sitting at 73 – bullish strength confirmed, but watch for short-term cooling or retest before next leg.
🧠 Final Thoughts: FORM is showing strong structural alignment with volume and momentum support. A healthy pullback could offer the next best opportunity before aiming for higher levels. Momentum traders will want to watch this closely.
Good trading!!

FORM/USDT: LONG SCALP SETUP!!🚀 FORM Bull Pennant Breakout – 15% Potential Incoming?! 👀🔥
Hey Traders! If you're all about high-conviction plays and real alpha, smash that 👍 and tap Follow for more setups that actually deliver! 💹💯
FORM is consolidating within a bullish pennant on the 1H chart after a strong 15% impulse move — classic continuation setup.
Price is hugging the triangle resistance and sitting above the 100 EMA, showing strength and reducing downside pressure.
📈 Entry: CMP and add more up to $2.83
🎯 Targets: $3.21 / $3.28 / $3.35
🛑 Stop-Loss: Below $2.78
📊 Risk-Reward: Excellent
💥 Bias: Bullish
📉 Leverage: Use low leverage (max 5x) for safer exposure
Keep your eyes on volume confirmation. A decisive move above the triangle could lead to another explosive leg up.
Agree with the setup? Drop your thoughts below! 👇

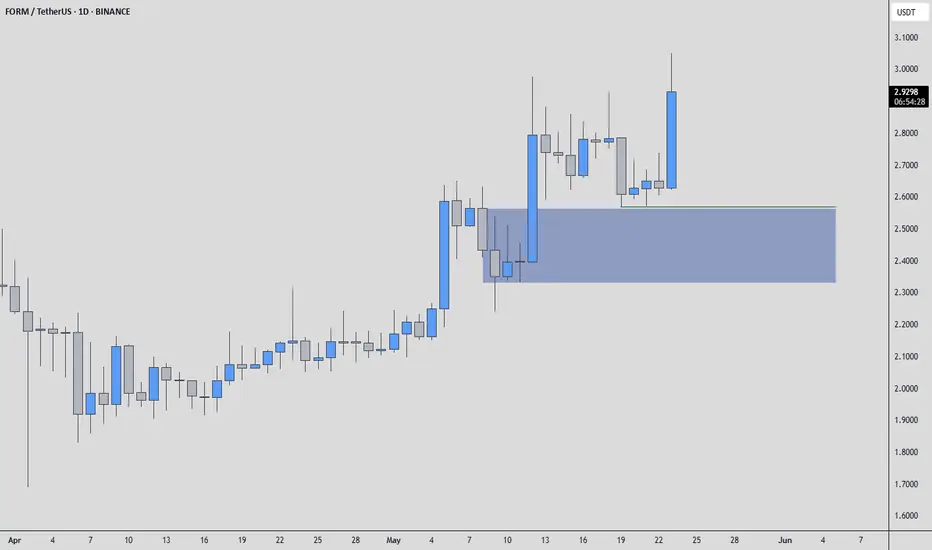
FORMUSDT | Buyer Interest Around the Blue BoxFORMUSDT is showing active buyers, and the blue box below stands out as a strong potential demand zone.
If price returns there, I’ll be looking for confirmation on lower timeframes. The setup is simple — strong zone, active interest, and a clear structure to lean on.
“I will not insist on my short idea. If the levels suddenly break upwards and do not give a downward break in the low time frame, I will not evaluate it. If they break upwards with volume and give a retest, I will look long.”
The market rewards those who wait for the right moment, not the loudest noise.
📌I keep my charts clean and simple because I believe clarity leads to better decisions.
📌My approach is built on years of experience and a solid track record. I don’t claim to know it all but I’m confident in my ability to spot high-probability setups.
📌If you would like to learn how to use the heatmap, cumulative volume delta and volume footprint techniques that I use below to determine very accurate demand regions, you can send me a private message. I help anyone who wants it completely free of charge.
🔑I have a long list of my proven technique below:
🎯 ZENUSDT.P: Patience & Profitability | %230 Reaction from the Sniper Entry
🐶 DOGEUSDT.P: Next Move
🎨 RENDERUSDT.P: Opportunity of the Month
💎 ETHUSDT.P: Where to Retrace
🟢 BNBUSDT.P: Potential Surge
📊 BTC Dominance: Reaction Zone
🌊 WAVESUSDT.P: Demand Zone Potential
🟣 UNIUSDT.P: Long-Term Trade
🔵 XRPUSDT.P: Entry Zones
🔗 LINKUSDT.P: Follow The River
📈 BTCUSDT.P: Two Key Demand Zones
🟩 POLUSDT: Bullish Momentum
🌟 PENDLEUSDT.P: Where Opportunity Meets Precision
🔥 BTCUSDT.P: Liquidation of Highly Leveraged Longs
🌊 SOLUSDT.P: SOL's Dip - Your Opportunity
🐸 1000PEPEUSDT.P: Prime Bounce Zone Unlocked
🚀 ETHUSDT.P: Set to Explode - Don't Miss This Game Changer
🤖 IQUSDT: Smart Plan
⚡️ PONDUSDT: A Trade Not Taken Is Better Than a Losing One
💼 STMXUSDT: 2 Buying Areas
🐢 TURBOUSDT: Buy Zones and Buyer Presence
🌍 ICPUSDT.P: Massive Upside Potential | Check the Trade Update For Seeing Results
🟠 IDEXUSDT: Spot Buy Area | %26 Profit if You Trade with MSB
📌 USUALUSDT: Buyers Are Active + %70 Profit in Total
🌟 FORTHUSDT: Sniper Entry +%26 Reaction
🐳 QKCUSDT: Sniper Entry +%57 Reaction
📊 BTC.D: Retest of Key Area Highly Likely
📊 XNOUSDT %80 Reaction with a Simple Blue Box!
📊 BELUSDT Amazing %120 Reaction!
📊 Simple Red Box, Extraordinary Results
I stopped adding to the list because it's kinda tiring to add 5-10 charts in every move but you can check my profile and see that it goes on..
$FORM Trade Setup 2H ChartPrice is consolidating below key resistance after a strong 30% move.
- Forming higher lows with bullish structure
- Breakout + Retest scenario in play
- Target: $3.74
- Stop-loss: $2.72
Watch for a breakout and retest entry for a low-risk, high-reward move! 👀🚀
DYRO, NFA

FORM/USDTKey Level Zone: 2.6080 - 2.6550
HMT v8.1 detected. The setup looks promising, supported by a previous upward/downward trend with increasing volume and momentum, presenting an excellent reward-to-risk opportunity.
HMT (High Momentum Trending):
HMT is based on trend, momentum, volume, and market structure across multiple timeframes. It highlights setups with strong potential for upward movement and higher rewards.
Whenever I spot a signal for my own trading, I’ll share it. Please note that conducting a comprehensive analysis on a single timeframe chart can be quite challenging and sometimes confusing. I appreciate your understanding of the effort involved.
Important Note :
Role of Key Levels:
- These zones are critical for analyzing price trends. If the key level zone holds, the price may continue trending in the expected direction. However, momentum may increase or decrease based on subsequent patterns.
- Breakouts: If the key level zone breaks, it signals a stop-out. For reversal traders, this presents an opportunity to consider switching direction, as the price often retests these zones, which may act as strong support-turned-resistance (or vice versa).
My Trading Rules
Risk Management
- Maximum risk per trade: 2.5%.
- Leverage: 5x.
Exit Strategy
Profit-Taking:
- Sell at least 70% on the 3rd wave up (LTF Wave 5).
- Typically, sell 50% during a high-volume spike.
- Adjust stop-loss to breakeven once the trade achieves a 1.5:1 reward-to-risk ratio.
- If the market shows signs of losing momentum or divergence, ill will exit at breakeven.
The market is highly dynamic and constantly changing. HMT signals and target profit (TP) levels are based on the current price and movement, but market conditions can shift instantly, so it is crucial to remain adaptable and follow the market's movement.
If you find this signal/analysis meaningful, kindly like and share it.
Thank you for your support~
Sharing this with love!
HMT v2.0:
- Major update to the Momentum indicator
- Reduced false signals from inaccurate momentum detection
- New screener with improved accuracy and fewer signals
HMT v3.0:
- Added liquidity factor to enhance trend continuation
- Improved potential for momentum-based plays
- Increased winning probability by reducing entries during peaks
HMT v3.1:
- Enhanced entry confirmation for improved reward-to-risk ratios
HMT v4.0:
- Incorporated buying and selling pressure in lower timeframes to enhance the probability of trending moves while optimizing entry timing and scaling
HMT v4.1:
- Enhanced take-profit (TP) target by incorporating market structure analysis
HMT v5 :
Date: 23/01/2025
- Refined wave analysis for trending conditions
- Incorporated lower timeframe (LTF) momentum to strengthen trend reliability
- Re-aligned and re-balanced entry conditions for improved accuracy
HMT v6 :
Date : 15/02/2025
- Integrated strong accumulation activity into in-depth wave analysis
HMT v7 :
Date : 20/03/2025
- Refined wave analysis along with accumulation and market sentiment
HMT v8 :
Date : 16/04/2025
- Fully restructured strategy logic
HMT v8.1 :
Date : 18/04/2025
- Refined Take Profit (TP) logic to be more conservative for improved win consistency

FORM PERPETUAL TRADE ,Sold From $2.76FORM PERPETUAL TRADE
FORM SELL SETUP
Currently $2.76
Sold From $2.76
(Trading plan If FORM go up to $2.86
will add more shorts)
Expecting target $2.67 OR DOWN
Incase of early exist will update this anaylsis
Its not a Financial advice

FORM PERPETUAL TRADE , Sold From $2.56FORM PERPETUAL TRADE
FORM SELL SETUP
Currently $2.56
Sold From $2.56
(Trading plan If FORM go up to $2.66
will add more shorts)
Expecting target $2.47 OR DOWN
Incase of early exist will update this anaylsis
Its not a Financial advice

FORM/USDT Analysis: ATH Incoming
This token has just tested its all-time high on Binance.
During the price increase, we spotted a strong volume zone between $2.48–$2.42, where the market is currently trading.
We are considering a long position targeting a new ATH.
This publication is not financial advice.

FORM / USDT Long Setup – Major Breakout Alert!🚀 FORM Breakout Alert – 50% Potential Incoming?! 👀🔥
Hey Traders! If you're all about high-conviction plays and real alpha, smash that 👍 and tap Follow for more setups that actually deliver! 💹💯
FORM has officially broken out of a massive symmetrical triangle on the 4H chart after weeks of tight consolidation. This is a classic technical setup that often leads to explosive moves, and the market is starting to pay attention! ⚡📈
📍 Entry Zone: $2.12 – $2.16
✅ Entry around the current breakout zone to catch early momentum.
🎯 Targets:
• Target 1 → $2.60 (key horizontal resistance)
• Target 2 → $2.90 (major breakout extension zone)
• Target 3 → $3.10+ (blue-sky breakout level)
🛡 Stop Loss (SL): $2.06 (just below the lower trendline and support zone)
💥 Why this setup is exciting:
✅ Clean triangle breakout after multi-week compression
✅ Strong historical pattern — last breakout ran over +50%
✅ EMA alignment turning bullish
✅ Volume spike on breakout confirmation
✅ Market sentiment improving with higher lows on the chart
🔑 Pro Trading Tips:
Watch for a retest of the $2.15 breakout zone — it may offer a second-chance entry.
Scale out profits gradually at each target zone to lock in gains.
Always use proper position sizing and stick to your SL to manage risk.
📢 Final Thoughts:
This setup has the technicals lined up for a potential trend expansion. If momentum continues and we see a confirmed retest, NASDAQ:FORM could deliver a textbook bullish move. Don’t ignore the opportunity — but trade smart!
💬 What’s your game plan for NASDAQ:FORM ? Share your targets, strategies, and thoughts below — let’s learn and win together! 👇👇👇

Which of the Multiple Patterns Will Play Out?Hey friends, I’m back with another great coin analysis. Today we’re looking at #FORMUSDT.P. On this coin, we have multiple formations, including the BULLISH WOLF WAVE FORMATION, a potential breakdown of a falling wedge, and perhaps a flag formation as well.
If we take the Wolf Wave formation as our main guide, our first target would be the $2.40 level, which corresponds to the 4th movement in the pattern. The second target, depending on the time frame, would be around the blue line, which is approximately $2.63.
If the flag formation plays out, we could potentially see a price range between $2.80 and $3.10.
Let’s watch and see how it goes. My long position is active with some leverage.
Let’s fish and see what happens! 🎯
Manage your risk, stay in the game! 🎯🔥
#AlyAnaliz #TradeSmart #CryptoVision #FORMUSDT #Binanciega

FORM SHORT SETUP ALL trading ideas have entry point + stop loss + take profit + Risk level.
hello Traders, here is the full analysis for this pair, let me know in the comment section below if you have any questions, the entry will be taken only if all rules of the strategies will be satisfied. I suggest you keep this pair on your watchlist and see if the rules of your strategy are satisfied. Please also refer to the Important Risk Notice linked below.
Disclaimer


FORMUSDT - SHORT TRADE IDEA - Breakdown Of Internal Structure...In this video, I demonstrate how AriasWave can help identify structures within patterns, even with limited data, to develop trading ideas. I also break down a short trade setup for this newly launched project.
Short Entry: At Market.
Stop Level: 1.95
Target: 1.47

#FORMUSDT: Quick Breakdown of a Long Setup!📉 Long BYBIT:FORMUSDT.P from $1.9037
🛡 Stop Loss: $1.8313
🕒 1H Timeframe
⚡️Overview:
➡️ Current Price: $1.8831 — this is where BYBIT:FORMUSDT.P is trading right now.
➡️ The price recently dropped from around $2.0000 to $1.4000 — a sharp decline! But then it started recovering and is now in a consolidation zone.
➡️ Volume: At the bottom of the chart, you can see volume bars. There was a particularly large volume at the $1.4000 level, where the price reversed. This suggests a lot of activity — possibly big players starting to buy.
➡️ Key Levels: The right side of the chart shows important price levels:
➡️ $1.8313 — stop loss to protect us from losses.
➡️ $1.8932 and $1.88313 — the nearest resistance levels that the price needs to break to move higher.
➡️ $1.7464 — a support level below, in case the price goes down.
🎯 TP Targets:
💎 TP 1: $1.9690
💎 TP 2: $2.0400
💎 TP 3: $2.0890
⚡️ Plan:
➡️ Entry Point: $1.9037 — this is the level to enter the buy. The price is currently slightly below ($1.8831), so we need to wait for it to rise to this mark.
➡️ Stop Loss: $1.8313 — if the price falls below this, the trade will close with a small loss to minimize risks.
Risk/ Reward: If we calculate, the distance from the entry to the stop loss is $0.0724, and to TP1 — $0.0653 (a ratio of nearly 1:1). To TP2 — $0.1363 (1:1.88), and to TP3 — $0.1853 (1:2.56). This is a good profit potential if the price moves up!
📢 The BYBIT:FORMUSDT.P price just bounced off the strong $1.4000 level, where there was high volume. This could be a signal that big players started buying, and the market is ready to rise.
📢 The $1.9037 level (entry point) aligns with the POC (Point of Control) — the zone with the highest trading volume, which often attracts the price.
📢 If the price breaks the resistance at $1.8932, it could easily reach $1.9037 and then move toward our targets.
🎯 How Does This Signal Relate to the Market?
The recent news about the resolution of the #Ripple vs. #SEC case, which I wrote about earlier, creates a positive backdrop for the entire crypto market.
➡️ When major projects like #Ripple gain clarity, it adds confidence to investors.
➡️ Altcoins like BYBIT:FORMUSDT.P can catch this wave of optimism.
➡️ If the market continues to rise, BYBIT:FORMUSDT.P has a chance to break resistance and move toward our targets!
➡️ Important: The crypto market is volatile, so don’t forget about risk management. Don’t risk more than 1-2% of your deposit on a single trade.

FORM/USDT Analysis: Beginning of a Bearish Trend?After its recent listing on Binance, the coin formed a strong level at $1.90 with multiple touches. Today, an attempt was made to break this level, resulting in numerous anomalies on the cluster chart and the formation of a strong volume zone at $1.93–$2.
If this zone is tested and a strong selling reaction appears, we open a short position. If there is no reaction and the price consolidates above this zone, it will confirm the buyers' intentions. In this case, we expect further upward movement and treat this zone as a mirror support level.
