$FORTH/#BTC [#Ampleforth Governance Token]: Resistance_Breakout◳◱ Hey traders, we've identified bullish signals on the $FORTH / $BTC chart through the detection of both a Bollinger Band breakout and a Resistance Breakout. The Bollinger Band indicates a potential bullish trend as the price has moved outside of the upper band, while the Resistance Breakout confirms this trend by showing the price breaking above a key resistance level. Given the alignment of these signals, it may be a good idea to consider entering a long position and targeting higher levels. Our analysis indicates that the key resistance levels are at 0.0002117 | 0.00025 | 0.0003161 and the major support zones are at 0.0001456 | 0.0001178 | 0.0000517. However, it is important to also consider other factors such as overall market conditions and other technical indicators before making a trade decision.
◰◲ Technical Metrics :
▣ Current price: 0.0001799 ₿
▣ 24H Volume: 11.970 ₿
▣ 24H Price change: 3.569%
◲◰ Pivot Points - Levels :
◥ Resistance: 0.0002117 | 0.00025 | 0.0003161
◢ Support: 0.0001456 | 0.0001178 | 0.0000517
◱◳ Indicators recommendation :
▣ Oscillators: NEUTRAL
▣ Moving Averages: BUY
◰◲ Technical Indicators Summary : NEUTRAL
◳◰ Market Sentiment Index :
▣ News sentiment score is N/A
▣ Twitter sentiment score is 0.54 - Bullish
▣ Reddit sentiment score is 0.66 - Bullish
▣ In-depth FORTHBTC technical analysis on Tradingview TA page
▣ What do you think of this analysis? Share your insights and let's discuss in the comments below. Your like, follow and support would be greatly appreciated!
▣ Welcome to the home of charting big: TradingView
Benefit from a ton of financial analysis features, instruments and data. Have a look around, and if you do choose to go with an upgraded plan, you'll get up to $30.
Discover it here
FORTHBTC trade ideas

$FORTH/#BTC [#Ampleforth Governance Token]: Failure_SwingWe've detected a Failure Swing pattern on the $FORTH / $BTC chart. This pattern is a bullish indication and could indicate a potential trend reversal. The next resistance key levels are at 0.0002117 | 0.00025 | 0.0003161 and the major support zones are respectively at 0.0001456 | 0.0001178 | 0.0000517. It is a bullish indication and we may consider buying at the current price zone of 0.0001775 and targetting higher levels.
Technical Metrics :
Current price: 0.0001775
24H Volume: 10.0664 Ƀ
24H Price change: 6.607%
- Pivot Points - Levels :
Resistance: 0.0002117 | 0.00025 | 0.0003161
Support: 0.0001456 | 0.0001178 | 0.0000517
Indicators recommandation :
Oscillators: NEUTRAL
Moving Averages: STRONG_BUY
Technical Indicators Summary : BUY
- In-depth FORTHBTC technical analysis on > Tradingview TA page
What do you think of this analysis? Share your insights and let's discuss in the comments below. Your like, follow and support would be greatly appreciated!
Welcome to the home of charting big: TradingView
Benefit from a ton of financial analysis features, instruments and data. Have a look around, and if you do choose to go with an upgraded plan, you'll get up to $30.
Discover it here

FORTHBTCHello friends, today you can review the technical analysis idea on a 1D linear scale chart for FORTHBTC
TARGET
0.0005700
buy and hold

Trading 101 | How To Be A Successful Trader In 300Words +3 StepsWe have a massive bullish breakout from a falling wedge for the FORTHBTC pair.
This is a strong one.
Green by 150% in 2 days... Yes, the Altcoins are going bullish or at least getting started as I warned just days ago.
This is not over.
This is not all.
We are not there yet.
There can be strong shakeouts within the Altcoins markets and will happen but the bigger picture needs to be kept in mind.
It doesn't matter if prices go up or down on many pairs at the same time, what really matters is that you follow your plan.
If prices drop and your stop-loss is not hit, what is the problem?
If prices drop and your stop-loss is hit, what is the problem?
If the stop-loss is hit you close the trade at a loss and move on.
If the stop-loss isn't hit you simply wait and act according to what you planned before buying into any trade.
Anything other than bearish/drop, we simply wait.
We set the sell orders on target BEFORE HAND... Collect the profits when the targets are met.
When the market is green/growing, when the markets go up your capital/balance will grow even if you make mistakes.
When the market is green everything goes green.
When the market is down/red, your capital MUST go down as well regardless of what you do.
If you want to exit the market, then you are in the market no more.
We buy low, we sell high and then we wait if the correction period is too strong.
That's it.
That's all.
Namaste.

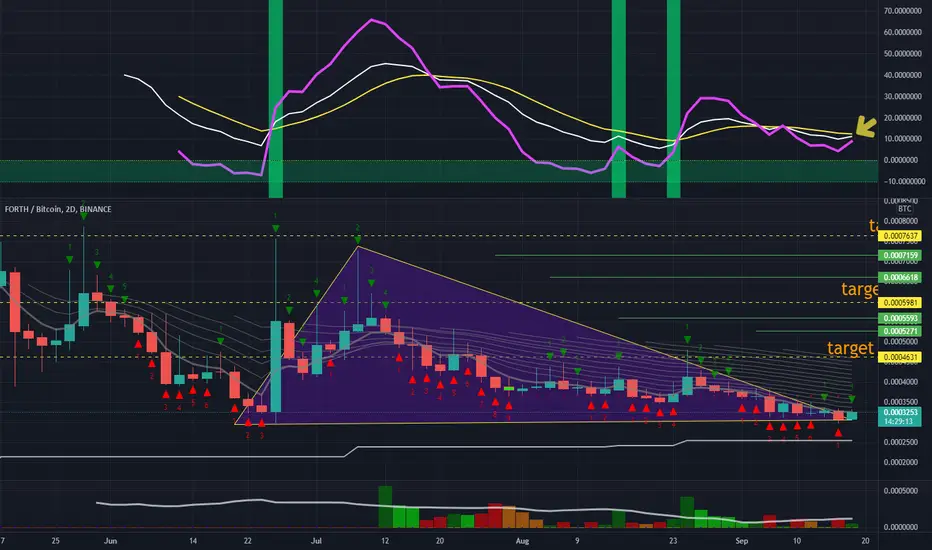
Forth buy signal and targetsThe KDJ indicator looks bullish here
Green lines also can be : targets = resistances
This triangle is representative of price influential
For other coins or opinions you can leave me a comment
happy Sunday

Keep selling it at dip and buy at highcheck "etherscan" and you will see big Holders bought it in April ... at 30-35 $.....You wanna sell this gem ???!!! Patient Patient .... Ive just bought some here and I will hold forever... Im crazy :)

FORTHBTC is testing an important resistance 🦐FORTHBTC is testing an important resistance. IF the price will have a breakout and retest the current resistance as new support, According to Plancton's strategy (check our Academy), we can set a nice order
–––––
Follow the Shrimp 🦐
Keep in mind.
🟣 Purple structure -> Monthly structure.
🔴 Red structure -> Weekly structure.
🔵 Blue structure -> Daily structure.
🟡 Yellow structure -> 4h structure.
⚫️ Black structure -> <4h structure.
Here is the Plancton0618 technical analysis, please comment below if you have any question.
The ENTRY in the market will be taken only if the condition of the Plancton0618 strategy will trigger.

FORTH Potential Bottom Bullish divergence on the daily RSI We could really see a solid bunce from here or around here. IMO.


