#FORTH (SPOT) to ( 2.5 $ ) ?#FORTH
The price is moving within a descending channel on the 1-hour frame and is expected to break and continue upward.
We have a trend to stabilize above the 100 moving average once again.
We have a downtrend on the RSI indicator that supports the upward break.
We have a support area at the lower boundary of the channel at 2.300, acting as strong support from which the price can rebound.
We have a major support area in green that pushed the price higher at 2.260.
Entry price: 2.335
First target: 2.380
Second target: 2.440
Third target: 2.500
To manage risk, don't forget stop loss and capital management.
When you reach the first target, save some profits and then change the stop order to an entry order.
For inquiries, please comment.
Thank you.
FORTHUSDT trade ideas

FORTHUSDT 1D#FORTH is trading near the descending resistance.
Consider buying here and near the support zone.
In case of a breakout above the descending resistance and the daily EMA50, the targets are:
🎯 $2.869
🎯 $3.458
🎯 $3.935
🎯 $4.411
🎯 $5.089
⚠️ Always use a tight stop-loss to manage risk and protect your capital.

Ampleforth 200%+ Bullish Breakout Explained & 267% TargetIn April, FORTHUSDT produced a 200%+ bullish breakout in just three days. The market has been sideways since, consolidating and this consolidation means preparation before the next move which can be something similar. The market is clearly bullish because of the higher low.
The major burst upward in early April confirms the bottom is in. A confirmed bottom once more simply means that Ampleforth is bullish; bullish means that the next major move is not a breakdown (drop) but a bullish jump. This is all confirmed based on the action from the past two months.
Knowing this, we can take action with a simple strategy of buy and hold. We buy waiting for the next market move to develop. When the market turns green, we collect profits and move on. Repeat the same process over and over, and watch your capital grow.
It doesn't matter how long it takes, patience is key; what matters is to be prepared to wait for as long as it takes. If you can wait 2 weeks, 3 weeks or 6 months, you can end up with a win. Some pairs will move in a matter of days, others in a matter of months. If you can't predict which one will move next, you can use a diversification strategy.
Just be prepare to win some, lose some. Not all trades can be won. But if wait for the winners to become big and keeping the losers small, that's a recipe for success.
Plan ahead of time.
There are countless ways to approach the market. It all depends on your trading style, your trading goals, your capital and risk tolerance... The only way to lose is to give up.
Perseverance is key.
Comeback for more.
Namaste.


Ampleforth Governance —2,000% Growth Potential & 4,000% TargetHere is another amazing example of a truly long-term consolidation market and a truly bottomed out Altcoin, with huge potential for growth. Ampleforth Governance (FORTHUSDT) produced the highest volume ever on the 7-April week. The long upper shadow on this candle shows that the bottom is in and that resistance has been removed; a new cycle of growth is about to start and the first step is in.
Listen (or, "look"), this is what is going to happen next: Long-term boomish growth.
Super fast accelerated out of the ordinary higher highs and up-strong. This is what will happen starting this same month.
What do I mean? This month FORTHUSDT will easily trade 200%, 300% or more higher, just as a start to continue growing long-term. This is the opportunity of a cycle, Bitcoin's 4-years cycle, to get in now and enjoy massive profits on the way up.
True trading requires buying when prices are low and waiting, just wait and the market grows. You can't go wrong at this point; think long-term.
Get your money into the market now, it is not too late and you will see how much growth will happen within months. It will be wild and lots of fun. The more the market grows, the better it will get.
This is not financial advice.
I am sharing my experience and personal understanding of the financial hieroglyphs that are technical charts.
The charts are saying up and you can use this knowing to become financially rich, the rest will follow.
Thanks a lot for your continued support.
Namaste.

1.37 RR or 4.5 RR2 different trades possible, better RR has higher risk of missing entry, but is overall safer and more profitable. I'll go with this and modify my position if it bounces convincingly sooner

FORTHUSDT Analysis: Monitoring Key Buyer Zones My previous analysis on FORTHUSDT was spot on, as you can see in this link: FORTHUSDT: Sniper Entry +%26 Reaction .
Currently, we still have buyer interest , but the overall market conditions are weak . If the first blue box is lost, I will avoid any entries until the lower blue box , which represents a stronger demand zone.
Key Points:
Buyer Interest: Present, but market sentiment remains fragile.
First Blue Box: Critical zone; losing it invalidates entries here.
Lower Blue Box: The next significant demand area for potential entries.
If you think this analysis helps you, please don't forget to boost and comment on this. These motivate me to share more insights with you!
I keep my charts clean and simple because I believe clarity leads to better decisions.
My approach is built on years of experience and a solid track record. I don’t claim to know it all, but I’m confident in my ability to spot high-probability setups.
If you'd like to learn how I use heatmaps, cumulative volume delta, and volume footprint techniques to identify highly accurate demand regions, feel free to send me a private message. I'm happy to assist anyone interested, with no charge or obligation.
My Previous Analysis
🐶 DOGEUSDT.P: Next Move
🎨 RENDERUSDT.P: Opportunity of the Month
💎 ETHUSDT.P: Where to Retrace
🟢 BNBUSDT.P: Potential Surge
📊 BTC Dominance: Reaction Zone
🌊 WAVESUSDT.P: Demand Zone Potential
🟣 UNIUSDT.P: Long-Term Trade
🔵 XRPUSDT.P: Entry Zones
🔗 LINKUSDT.P: Follow The River
📈 BTCUSDT.P: Two Key Demand Zones
🟩 POLUSDT: Bullish Momentum
🌟 PENDLEUSDT.P: Where Opportunity Meets Precision
🔥 BTCUSDT.P: Liquidation of Highly Leveraged Longs
🌊 SOLUSDT.P: SOL's Dip - Your Opportunity
🐸 1000PEPEUSDT.P: Prime Bounce Zone Unlocked
🚀 ETHUSDT.P: Set to Explode - Don't Miss This Game Changer
🤖 IQUSDT: Smart Plan
⚡️ PONDUSDT: A Trade Not Taken Is Better Than a Losing One
💼 STMXUSDT: 2 Buying Areas
🐢 TURBOUSDT: Buy Zones and Buyer Presence
🌍 ICPUSDT.P: Massive Upside Potential | Check the Trade Update For Seeing Results
🟠 IDEXUSDT: Spot Buy Area | %26 Profit if You Trade with MSB
📌 USUALUSDT: Buyers Are Active + %70 Profit in Total
🌟 FORTHUSDT: Sniper Entry +%26 Reaction
I stopped adding to the list because it's kinda tiring to add 5-10 charts in every move but you can check my profile and see that it goes on..

FORTHUSDT | Huge Volume IncreaseVolume Surge: FORTHUSDT has experienced a significant increase in trading volume.
Key Points:
Blue Boxes: Identify potential zones where buyer activity may pick up.
Conclusion: The notable rise in volume signals growing interest. Keep an eye on the blue box areas for potential entry points where buyers might become active.
I keep my charts clean and simple because I believe clarity leads to better decisions.
My approach is built on years of experience and a solid track record. I don’t claim to know it all, but I’m confident in my ability to spot high-probability setups.
My Previous Analysis
🐶 DOGEUSDT.P: Next Move
🎨 RENDERUSDT.P: Opportunity of the Month
💎 ETHUSDT.P: Where to Retrace
🟢 BNBUSDT.P: Potential Surge
📊 BTC Dominance: Reaction Zone
🌊 WAVESUSDT.P: Demand Zone Potential
🟣 UNIUSDT.P: Long-Term Trade
🔵 XRPUSDT.P: Entry Zones
🔗 LINKUSDT.P: Follow The River
📈 BTCUSDT.P: Two Key Demand Zones
🟩 POLUSDT: Bullish Momentum
🌟 PENDLEUSDT: Where Opportunity Meets Precision
🔥 BTCUSDT.P: Liquidation of Highly Leveraged Longs
🌊 SOLUSDT.P: SOL's Dip - Your Opportunity
🐸 1000PEPEUSDT.P: Prime Bounce Zone Unlocked
🚀 ETHUSDT.P: Set to Explode - Don't Miss This Game Changer
🤖 IQUSDT: Smart Plan
⚡️ PONDUSDT: A Trade Not Taken Is Better Than a Losing One
💼 STMXUSDT: 2 Buying Areas

FORTHUSDT | %800 DAILY VOLUME SPIKE HUGE OPPORTUNITYFORTHUSDT Analysis Update
We are observing an 800% increase in volume on FORTHUSDT, buyers are active but I will still wait good prices. I think I can get my profits from here as long as the market doesn't go too bad.
Long trades can be planned based on the reactions in the lower time frames near the green line and blue box levels.
I will monitor these zones for potential shifts in buyer activity and upward momentum before executing trades.
I keep my charts clean and simple because I believe clarity leads to better decisions.
My approach is built on years of experience and a solid track record. I don’t claim to know it all, but I’m confident in my ability to spot high-probability setups.
My Previous Analysis
🐶 DOGEUSDT.P: Next Move
🎨 RENDERUSDT.P: Opportunity of the Month
💎 ETHUSDT.P: Where to Retrace
🟢 BNBUSDT.P: Potential Surge
📊 BTC Dominance: Reaction Zone
🌊 WAVESUSDT.P: Demand Zone Potential
🟣 UNIUSDT.P: Long-Term Trade
🔵 XRPUSDT.P: Entry Zones
🔗 LINKUSDT.P: Follow The River
📈 BTCUSDT.P: Two Key Demand Zones
🟩 POLUSDT: Bullish Momentum
🌟 PENDLEUSDT.P: Where Opportunity Meets Precision
🔥 BTCUSDT.P: Liquidation of Highly Leveraged Longs
🌊 SOLUSDT.P: SOL's Dip - Your Opportunity
🐸 1000PEPEUSDT.P: Prime Bounce Zone Unlocked
🚀 ETHUSDT.P: Set to Explode - Don't Miss This Game Changer
🤖 IQUSDT: Smart Plan
⚡️ PONDUSDT: A Trade Not Taken Is Better Than a Losing One
💼 STMXUSDT: 2 Buying Areas
🐢 TURBOUSDT: Buy Zones and Buyer Presence
🌍 ICPUSDT.P: Massive Upside Potential | Check the Trade Update For Seeing Results
🟠 IDEXUSDT: Spot Buy Area | %26 Profit if You Trade with MSB
📌 USUALUSDT: Buyers Are Active

#FORTH (SPOT) entry range( 2.600- 3.170) T.(5.450) SL(2.517)BINANCE:FORTHUSDT
entry range( 2.600- 3.170)
Target1 (4.246) - Target2 (5.450)
1 Extra Targets(optional) in chart, if you like to continue in the trade with making stoploss very high.
SL .1D close below (2.517)
*** collect the coin slowly in the entry range ***
*** No FOMO - No Rush , it is a long journey ***
**** #Manta ,#OMNI, #DYM, #AI, #IO, #XAI , #ACE #NFP #RAD #WLD #ORDI #BLUR #SUI #Voxel #AEVO #VITE #APE #RDNT #FLUX #NMR #VANRY #TRB #HBAR #DGB #XEC #ERN #ALT #IO #ACA #HIVE #ASTR #ARDR #PIXEL #LTO #AERGO #SCRT #ATA #HOOK #FLOW #KSM #HFT #MINA #DATA #SC #JOE #RDNT #IQ #CFX #BICO #CTSI #KMD #FXS #DEGO #FORTH ****

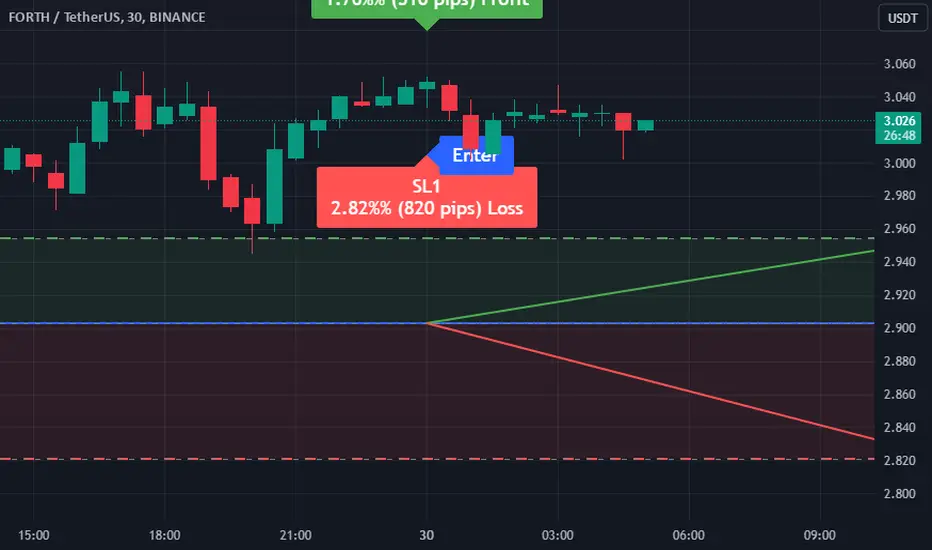
Trade Signal for FORTH/USDTDirection: Buy
Enter Price: 2.903
Take Profit: 2.954
Stop Loss: 2.821
We have identified a promising opportunity for the FORTH/USDT currency pair using the EASY Quantum Ai strategy. The parameters suggest a bullish movement, warranting a "Buy" position. Here's our analysis:
1. Market Momentum: Recent market momentum indicates a positive trend, as volume increase aligns with an upward price trajectory.
2. Technical Indicators: Key technical indicators, such as Moving Averages and RSI, support a bullish outlook. The RSI is approaching oversold territory, suggesting potential for price reversal upwards.
3. Support and Resistance Levels: The price near 2.903 is a tested support level, implying a reliable entry point as buyers tend to defend this position. The rally towards the 2.954 resistance level aligns with expected profit-taking behavior.
4. Risk Management: A stop loss is strategically set at 2.821 to mitigate unexpected downward movements, ensuring controlled risk exposure.
This forecast and entry suggestion are derived using the trusted EASY Quantum Ai strategy, which leverages historical data and current market dynamics for accurate predictions. As always, please exercise due diligence and consider market conditions before entering any trade.
FORTHUSDT Trading Signal: Sell OpportunityAttention traders! We have a new trading signal for the FORTHUSDT pair based on the EASY Quantum Ai strategy. Here are the details:
Direction: Sell
Enter Price: 3.165
Take Profit: 3.11233333
Stop Loss: 3.25833333
Our EASY Quantum Ai strategy has identified a potential downward movement in the FORTHUSDT pair. This prediction is grounded in several key factors:
1. Market Sentiment: Current market sentiment analysis indicates bearish momentum, with growing sell pressure in the market.
2. Technical Indicators: Multiple technical indicators such as RSI and MACD are reflecting overbought conditions, suggesting a likely reversal or price correction.
3. Volume Analysis: A recent increase in sell volume provides further evidence supporting the bearish trend foreseen by our AI algorithms.
These factors contribute to our conviction that a sell position might offer a profitable opportunity. As always, traders are encouraged to consider their own analysis before executing the trade.
Stay informed and trade wisely!

Trade Signal for FORTHUSDT: Sell OpportunityAttention traders! Our analysis using the EASY Quantum Ai strategy has identified a potential Sell opportunity for the FORTHUSDT currency pair.
Enter Price: 3.165
Take Profit: 3.11233333
Stop Loss: 3.25833333
Several factors contribute to this forecast. Firstly, our strategy has detected a bearish trend, suggesting the potential for price decline from the current levels. Additionally, market sentiment and technical indicators reveal weakening buyer momentum, which could lead to further downward movement.
The EASY Quantum Ai strategy incorporates deep analysis of historical data and current market conditions, providing a comprehensive outlook. This signal cue is designed to maximize your potential profit while minimizing risks with a carefully positioned stop loss.
Please ensure to manage your risk appropriately and consider market volatility before entering the trade.
Stay updated for more insights and keep an eye on any market changes that might affect the trade outlook.
Happy trading!
Disclaimer: Trading involves substantial risk and is not suitable for every investor.

FORTHUSDT.4HUpon analyzing the FORTH/USDT 4-hour chart, here’s my detailed breakdown based on the displayed technical indicators and chart patterns:
Key Resistance and Support Levels:
Resistance 1 (R1) at $3.634: This is an immediate ceiling where the price has struggled previously. Overcoming this resistance could potentially lead to more bullish momentum.
Resistance 2 (R2) at $4.332: Surpassing R1 could set the stage for a test of this higher resistance level, where further significant selling pressure may emerge.
Support 1 (S1) at $2.275: Currently acting as the primary support level, a breach below this could indicate a return to bearish sentiment.
Technical Indicators:
MACD (Moving Average Convergence Divergence): The MACD line is slightly below the signal line, indicating a bearish crossover recently occurred. However, the histogram is very close to zero, suggesting that bearish momentum may not be strongly pronounced at the moment.
RSI (Relative Strength Index): The RSI is just below the midline at 48.15, indicating a slight bearish bias in market sentiment but still close enough to neutral, suggesting potential for either movement.
Volume:
As volume details are not visible, it’s essential to confirm any breakout or breakdown with volume support. Higher volume on a price increase could validate a bullish breakout, whereas higher volume on a decline could confirm bearish control.
Conclusion: Given the current position between S1 and R1, the market appears to be in a consolidation phase with a slight bearish inclination as indicated by the MACD. I recommend monitoring for a potential breakout above R1, which could provide a bullish trading opportunity targeting R2. Conversely, a breakdown below S1 should be approached with caution, as it might suggest a stronger bearish trend is underway. Always consider placing stop-loss orders to manage risks effectively, particularly given the current indecisiveness in the market. Additionally, keep an eye on macroeconomic factors and broader market sentiment that could influence FORTH's price movements.

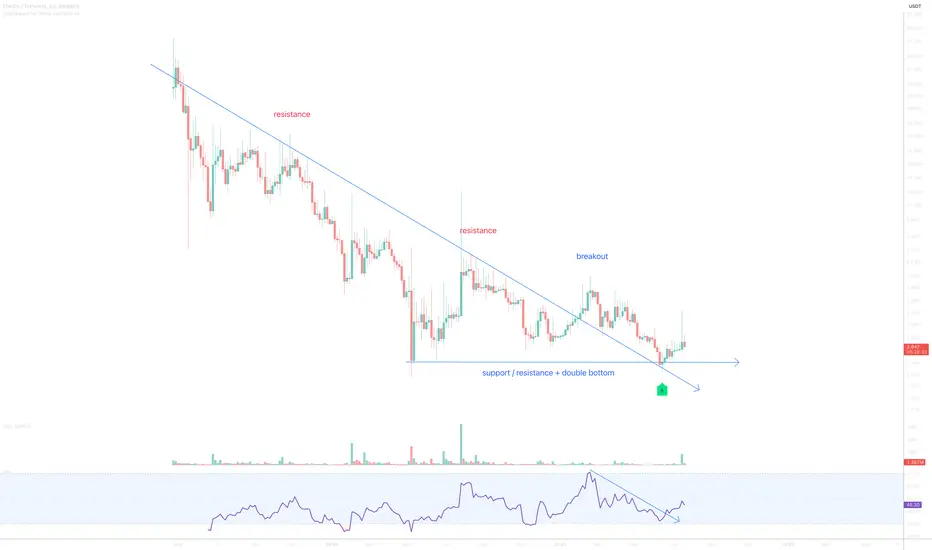
Alikze »» FORTH | Descending channel🔍 Technical analysis: Descending channel
- The 4H frame time is moving in a descending channel.
- Currently, in a limited range, the rangeing of a corporate pattern can have a downward refinement by testing the area.
- Therefore, if it is exposed to a sales pressure after colliding with a dynamic trigger and the range of sale, it can have a 273 and green box.
💎 Alternative scenario: If it can defeat the red box and the dynamic trigger, it can test the decline channel roof.
🛑 Resistance range: 3.22 - 3.32
🟩 Support range: 2.54-2.64
»»»«««»»»«««»»»«««
Please support this idea with a LIKE and COMMENT if you find it useful and Click "Follow" on our profile if you'd like these trade ideas delivered straight to your email in the future.
Thanks for your continued support.
Best Regards,❤️
Alikze.
»»»«««»»»«««»»»«««
www.radingview.com

FORTH/USDT I BUY SETUP✔︎📈 SIGNAL : BINANCE:FORTHUSDT
✔︎ENTRY : 4.160
🏓TARGETS :
✔︎T1 : 4.453
✔︎T2 : 4.893
✘STOP : 3.867
🚦Stop Trigger:
• If you make capital management: Stop is activated when one candle opening and closing
below the stop level of the same time frame of the signal.
• If you don't make capital management: Stop is direct without waiting for the candle to close.
💡Risk management :
• Enter the trade with 10% to 20% of your capital to reduce risk and save cash to enter other opportunities.
• Sell (25% to 50%) on (T1) and don't move your stop-loss.
• Sell 50% on (T2) and move your stop loss to the entry point.
• You are safe now, and the next 25% is up to you.
💡Reason for this trade:
This trade gives my trading system a sign of strength:
• My trading system is based on liquidity and reversal zones.
• When the liquidity is swept from one side under certain conditions, we will wait for the price on the other side.
The liquidity will attract the price like a magnet.
• the first side that has been swept:
1- failure swing point
2- monthely open
3- liquidity pool
• Opposite side targets:
1- previous weekly high
2- liquidity void
3- range low
💡Entry setup
1- reclaim liquidity pool zone
⚠️WARNING:
• I'm not a financial advisor.
• Do your own research (DYOR).

Forth USDT Plans Forth Plans shared with charts in range, it breaks the trend line and reclaim it and going up i mentioned TP's let see maarket proves me wrong or right

FORTHUSDT Daily tf Range Updated till 23-03-24FORTHUSDT Daily timeframe range. PA is holding well despite markets bleeding for now. claimed 6.967 level again that could led it back to 9.119. 5.060 is a solid retrace point but thats if it fails at 6.967.

FORTHUSDT 1W LONG📈Hi all. Timeframe 1 week. FORTHUSDT has formed a triangle and is at key resistance. Increased buyer volume. I’m considering recruiting to the spot now, with a pick-up from the green zone (a return to it is unlikely). Also long during breakout/retest. Marked goals and levels on the chart.

THE BREAK OF FORTHForth seems on the important level to make the next break trend in level.
We will follow the trend for confirmation.
The chance that FORTH can break is 80%
This all depends on high data.
Expecting the coin could do between $9.50 and $16.34

Ampleforth Governance Extremely Bullish (139% - 343% Potential)This one is looking really good... As usual, there are so many signals that are positive that is hard to know where to start.
Ok... Ampleforth Governance produced a long-term bottom pattern.
The bottom/low happened May 2022, much sooner compared to other Altcoins that bottomed June/July 2023; which means that this pair is much stronger.
The current action is already happening above MA200 and this means that long-term growth is possible.
Long-term can be 6 months but long long-term can go between 6-12 months. Which makes a pair like this an easy win.
For this current wave, the most likely target sits around $10 for 139% but it can definitely go higher and this is shown on the chart.
Volume is low with strong bullish action which only means that there is no resistance as prices grow. The bulls are not using their ammunition and this is good because when resistance does show up, there will be ready to buy and push prices high. According to the chart.
Namaste.


Ampleforth Governance Token (FORTH)On the above 4-day chart price action has corrected over 90%. Today is great long opportunity. Why?
1) RSI and price action resistance breakouts.
2) Multiple oscillators print bullish divergence with price action.
3) Price action prints support on past resistance since breakout. Look left.
Is it possible price action falls further? Sure.
Is it probable? No.
Ww
Type: trade
Risk: <=6% of portfolio
Timeframe: Now, don’t sit on your hands.
Return: no idea