FTSE 100 Index forum
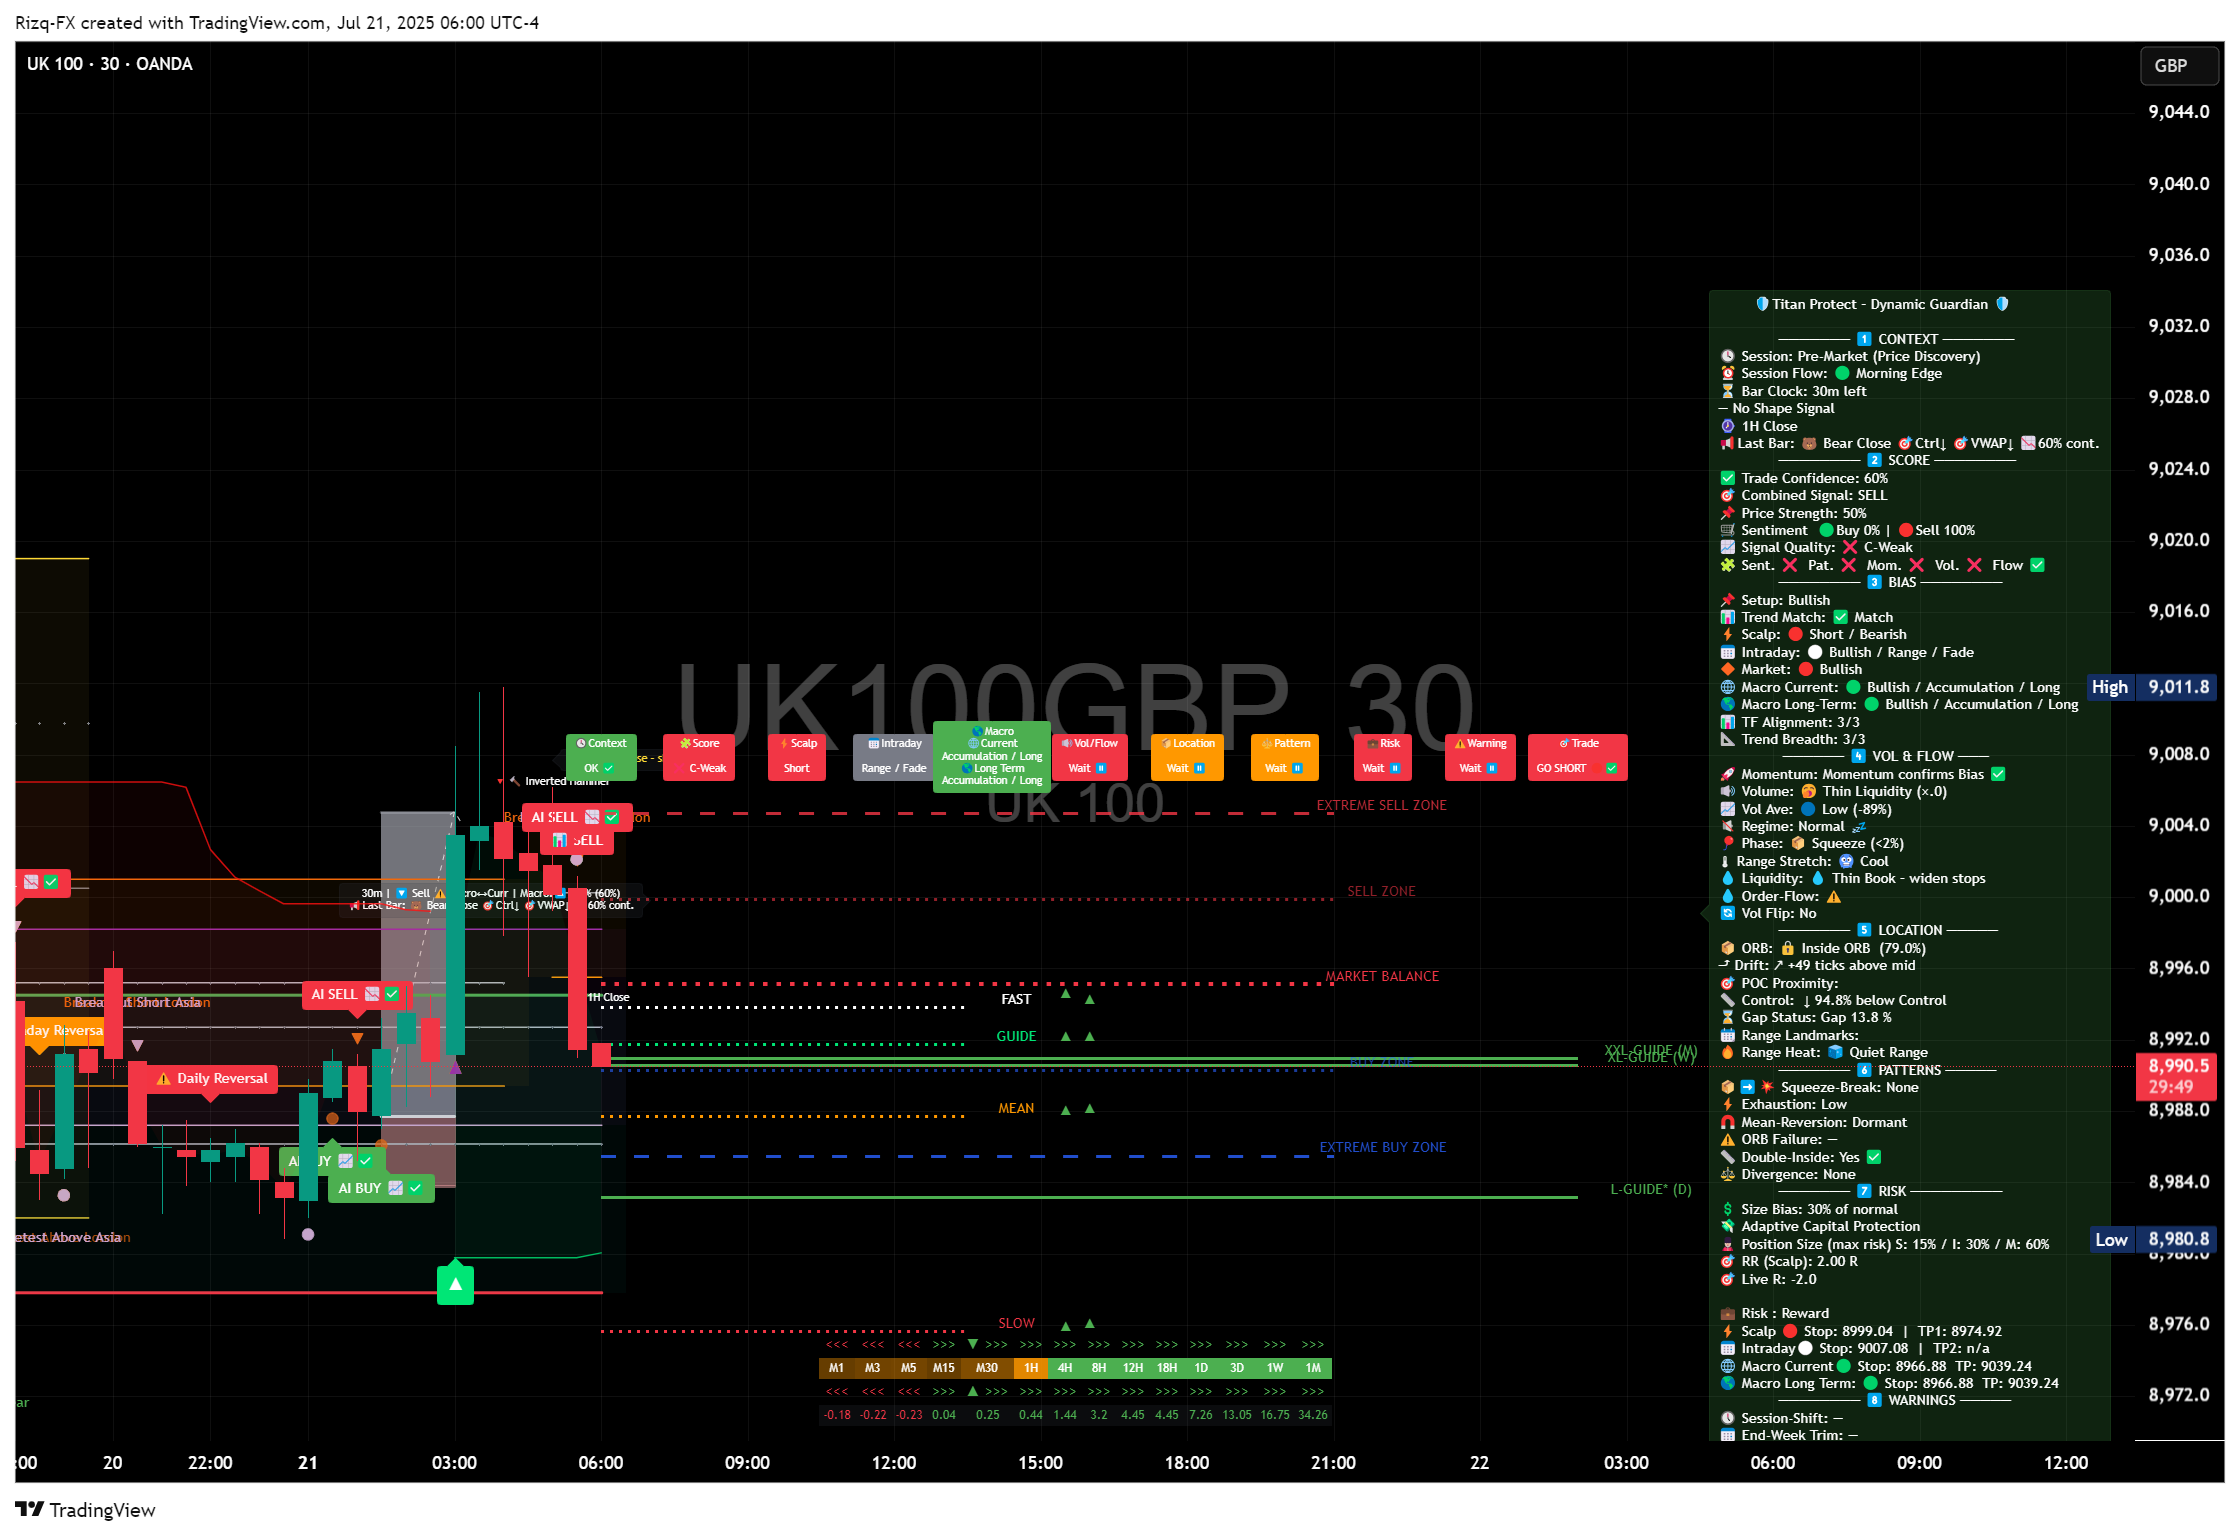
Was an easy 1:4 R this morning, as per the early smart money post, will be looking for another reload opportunity. All 3 indices  UK100GBP
  NAS100USD
  SPX500USD offered the same trade.
Best Wishes and Success to All
🛡️ Take Profits, Not Chances.
💰 Manage Risk to Accumulate.
🎯 React with Clarity, Not Hope.
🌊 Flow with Intelligence, Not Noise.
⚙️ Views are Personal & Educational
🎯 Summary posts only. Full context via DM
Best Wishes and Success to All
🛡️ Take Profits, Not Chances.
💰 Manage Risk to Accumulate.
🎯 React with Clarity, Not Hope.
🌊 Flow with Intelligence, Not Noise.
⚙️ Views are Personal & Educational
🎯 Summary posts only. Full context via DM
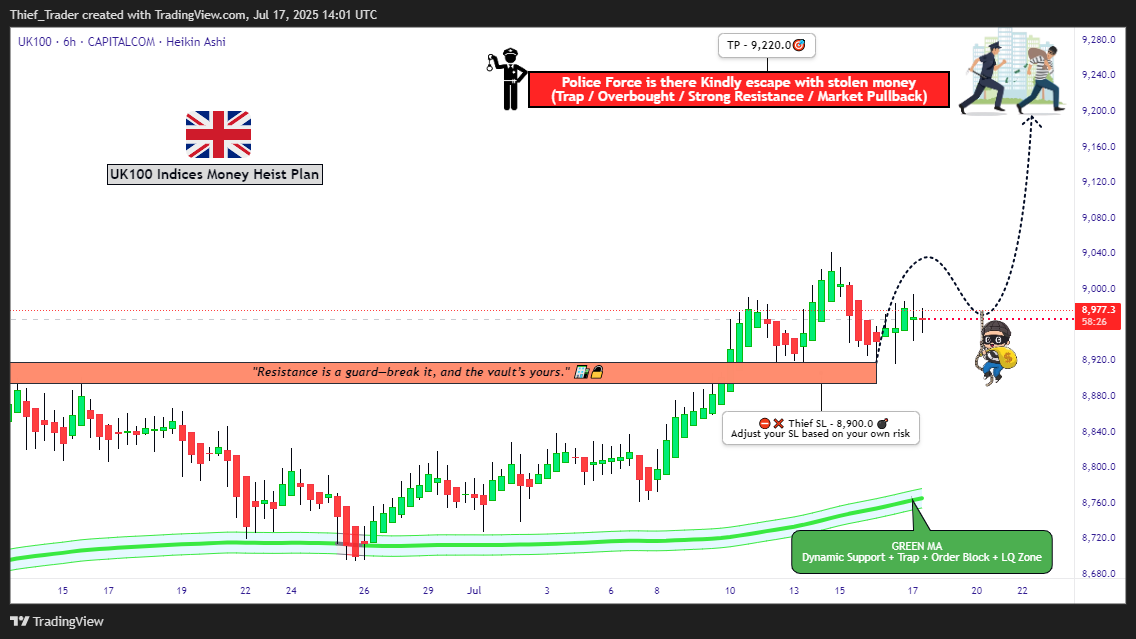
To all the Market Robbers, Smart Thieves, and Strategic Money Makers — welcome to another Thief Trading Heist Plan™.
Ready your gear and charts — the UK100 / FTSE100 index is our next vault.
🔥Heist Objective: Swipe the Bullish Loot Before the Police Trap Hits! 🔥
Based on sharp Thief-style technical and macro-fundamental analysis, the market is showing bullish exhaustion and early signs of trap reversal zones. Our goal is clear: extract max value from the bulls and escape before the heat catches on.
🚨The current price action is nearing a Red Zone — high-risk area filled with potential police traps (supply zones, resistance, and bear setups). Timing and smart entries are key.
🎯 Strategy Overview (Day/Swing Trade)
Entry Plan:
🟢 “The Vault’s Open!” – Start accumulating long positions now or set buy limits near recent 15m/30m swing lows. Layer your entries (DCA method) for better control and efficiency.
Stop Loss (SL):
🔐 SL below recent swing low on 4H timeframe (~8900.0)
Adjust based on your risk appetite, position size, and how many layered orders you've got lined up.
Target Zone (TP):
🏁 Primary Target: 9220.0
Always be ready to exit early if market signals shift. He who escapes lives to rob another day.