Nas100/US100 Short Setup based on Fundamentals
Hello everyone. We have seen the Nasdaq form a new local top at the 22k area and is now heading back down.
There are many reasons why price is falling but remember this only a temporary sell off as the master trend on the highest time frame is up not down.
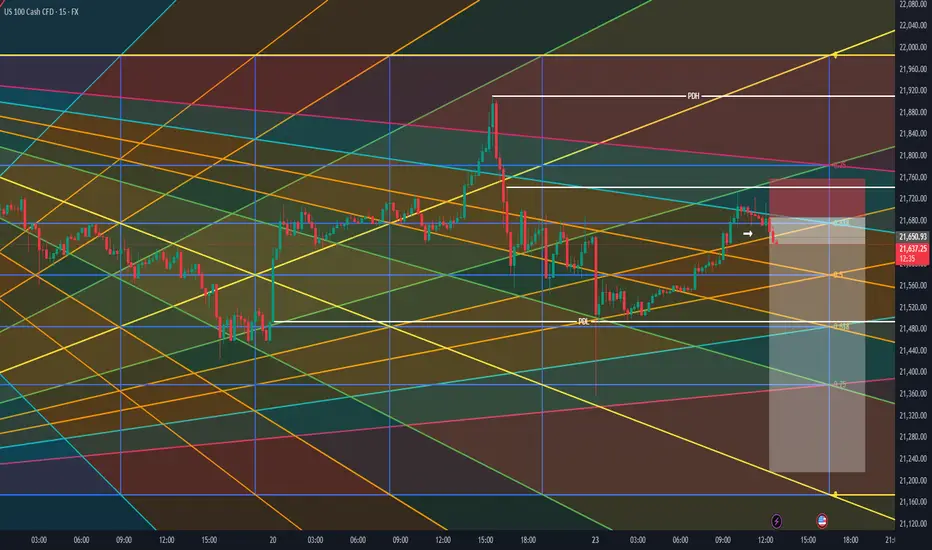
Today (Friday 20th June) is OPEX. $6.6 Trillion of options are set to expire today and the Max Pain level is 21,500. Price could drive there to render most options worthless.
Institutions and hedge funds have increasingly added short positions or are sitting on the side lines. Indicating lack of buying from the larger players for the time being.
Buying volume is lower than the selling volume at the top of this rally.
We have 2 weeks roughly until trump tarrifs are implemented and not many trade deals have been made.
Iran-Israel conflict with a possible US involvement.
FED is leaning towards a more hawkish approach due to tarrifs but says the US economy is still growing.
How I am looking at this for the near future. In the chart I have marked my entry, My SL, My Max TP and where I would take partials on the way down. I may also even scale in more if I see the opportunity.
Thanks for reading.
US100 trade ideas

NAS100 | Intraday buy setupTimeframe: M15
🔸 Bias: Short-term bullish (scalp to premium zone)
Price just tapped into a fresh M15 demand zone following a strong impulsive leg and is now showing early signs of a reaction (entry model confirmation ✅). Liquidity has been taken beneath the short-term low, and I'm now looking for a short-term push back into the premium supply area near 21,800.
🧩 Confluences:
Bullish BOS + Demand zone reaction
Liquidity sweep below Asian session low
Entry model + candle shift on M15
Potential reversal from discount → premium
🎯 Target: 21,800 zone
❌ Invalidation: Clean break & hold below 21,675
⏳ Type: Intraday scalp / short-term swing
“Risk managed. Liquidity collected. Now we let price tell the rest of the story.” 🚀

NAS100 - Will the stock market continue to rise?!The index is trading in its short-term descending channel on the four-hour timeframe between EMA200 and EMA50. If there is no re-up and the channel is broken, I expect a correction to form, the target of which can be the bottom of the descending channel.
If the channel top is broken, we can expect a new ATH to be recorded in the Nasdaq index. It is better to wait for confirmation in case of a breakdown in order to control the risk further.
Over the past week, the Nasdaq has managed to stay within a stable range, especially despite geopolitical pressures, mixed signals from the Federal Reserve, and some concerns in the semiconductor sector. This stability is largely due to the strong fundamentals of large technology companies, the reduction in distribution days (selling pressure) in the market, and renewed expectations of interest rate cuts later in the year.
At a structural level, the number of distribution days, which indicate selling pressure from large institutions, has reached a relatively low number of 3 days in the Nasdaq over the past month. This is a sign of the weakness of heavy selling at price peaks and the market's willingness to maintain long positions. Unlike trends seen in previous years, this time the market has shown no signs of widespread divergence or fundamental weakness, even despite strong inflation data or concerns about new trade restrictions with China.
This trend is largely supported by the stellar performance of companies such as Nvidia, Microsoft, Apple and other major players in the artificial intelligence and technology sectors. Revenue growth, increased investment in AI infrastructure, as well as the return of institutional investors’ confidence in technology stocks, have led the Nasdaq to record significant returns since the beginning of 2025. Analysts from major financial institutions such as Goldman Sachs and Morgan Stanley, while warning of potential selling pressure on the index, remain positive about continued growth, of course, assuming that economic data does not deviate from the expected path.
However, some risks are clearly visible in the trading week ahead. The most important of them is the possibility of geopolitical tensions again affecting the market. In recent days, oil prices have risen and financial markets have experienced moments of fear after tensions in the Middle East escalated and the US political response to Iran and Israel's moves. Although the Nasdaq was able to withstand these fluctuations, the market remains very sensitive to energy price spikes and their impact on inflation.
Important data in the coming week could also determine the market's direction. The release of the Core PCE index, the Fed's preferred inflation measure, as well as data on unemployment insurance claims, both play a key role in the interest rate outlook. If inflation data is lower than expected, the likelihood that the Fed will start cutting rates in September or November increases, which would be a bullish stimulus for the stock market and especially the Nasdaq.
On the other hand, potential pressure on the semiconductor group - especially if new restrictions on technology exports to China are imposed - could disrupt the market trend. Last Friday, just one news report on the possibility of restricting exports of advanced chipsets caused the Nasdaq to fall by more than 0.6%. If this trend becomes official US government policy, it could cause a correction in stocks of companies such as Nvidia, AMD and ASML, which are heavy weights in the Nasdaq index.
In addition to these factors, next week will also see the release of quarterly reports from major companies such as Micron, FedEx and Nike. The results of these reports, especially in the area of sales and cost forecasts, could affect economic growth expectations. If the figures are better than expected, the Nasdaq could move towards new highs. However, if the data is released, the market could enter a short-term correction phase.
In terms of correlation with monetary policy, the Nasdaq index has become more sensitive than ever to interest rates and cash flows. The dollar price, real interest rates, and the direction of Treasury bonds all now have a direct impact on the valuation of technology companies. As a result, any change in the path of monetary tightening or easing is immediately reflected in the Nasdaq’s performance. However, analysts believe that the market will remain in a “wait and see” phase until the official data is released in July. In summary, the Nasdaq index is currently in a situation where its fundamentals are supported by the profitability of large technology companies, the easing of institutional selling pressure, and the possibility of a rate cut. At the same time, the market remains highly sensitive to major geopolitical news, trade policy, and economic data. As a result, the week ahead can be considered a “two-sided” period, where opportunities and threats are in a delicate balance, and only economic data and quarterly results can tip the balance in the direction of an increase or a correction.

Nasdaq continuation sellsH4: STILL BULLISH INTERNALLY WITH OUR LAST SIGNIFICANT HL AT 21000
-Possible major chOch on H4 is very possible due to the HTF major zone we at
-Wait for proper H1 & lower tineframe confirmations before jumping in any trades
H1: BEARISH MARKET STRUCTURE STARTING TO PLAY WITH LAST LH AT 21925
-Potential continuation of sells all the way down to take out H4 hl a 21000
-We recently broke below a buying range on H1 & created a selling range
-Possible pullback buys before sells within that range are imminent
M15: We have a nice supply+fvg for sells at 21835
-Wait for price to pullback in there then M1 chOch then attack

Triple Top Forming on NAS100? Reversal Attempt BrewingNAS100 may be carving out a triple top or micro head-and-shoulders, hinting at a potential short-term reversal. A confirmed break of the current range is still required to validate downside momentum. With heightened geopolitical risk (U.S. strike on Iran), capital may rotate into gold and oil, weighing on equities. This is a low-risk, short-term idea only—more structure and confirmation needed before hunting larger trend moves.

NASS1001. Nasdaq 100 (NASS100) Performance
As of mid-June 2025, the Nasdaq 100 index is around 21,600 to 21,700 points, showing moderate volatility with recent declines amid geopolitical tensions and trade concerns.
Technology stocks, including semiconductor giants like NVIDIA and Broadcom, remain influential on Nasdaq movements.
Market sentiment is cautious due to escalating Middle East conflicts and US-China trade uncertainties.
2. US 10-Year Treasury Yield (US10Y)
The US 10-year Treasury yield is hovering around 4.3% to 4.4% in June 2025.
Yields have edged up recently, reflecting inflation expectations and Federal Reserve monetary policy stance.
Rising yields often pressure growth stocks, including tech-heavy Nasdaq components, due to higher discount rates on future earnings.
3. US Dollar Index (DXY) Dynamics
The DXY has been relatively stable but showed some weakening in 2025 despite rising Treasury yields, reflecting complex market dynamics including geopolitical risks and shifts in capital flows.
A weaker dollar can support Nasdaq by boosting earnings of multinational tech firms through favorable currency translation, while a stronger dollar can weigh on exports and earnings.
4. Interplay Between NASS100, US10Y, and DXY
Rising US10Y yields tend to put downward pressure on Nasdaq 100 due to increased discount rates and borrowing costs for growth companies.
DXY movements influence Nasdaq via currency effects on multinational revenues and investor risk appetite.
Recent geopolitical tensions and trade uncertainties have increased market volatility, occasionally decoupling typical correlations.
Softer inflation and weak labor data have temporarily boosted investor sentiment, supporting modest Nasdaq gains despite yield pressures.
Conclusion
the Nasdaq 100 faces pressure from rising US 10-year Treasury yields, which increase discount rates on tech stocks, while geopolitical tensions and trade uncertainties add volatility. The US Dollar Index’s relative weakness provides some support to Nasdaq earnings, partially offsetting yield headwinds. Market participants remain cautious, balancing inflation data, Fed policy, and global risks in their outlook.
#NASS100

USTECH H4 AnalysisUSTECH Showing a bullish Flag. If it breaks this zone above, Most probably can fly up to 22,106.35 and higher TO 23,200. If no, Can rally between 20,800, 20,400 or even lower. Trading Analysis from 23-06-25 to 27-06-25. Take your risk under control and wait for market to break support or resistance on smaller time frame. Best of luck everyone and happy trading.🤗

Market Structure 1hr According to what's happening between Iran and Isreal and Trump has attacked Iran in my anticipation and what I do see in the marketplace honestly right now and how the markets has been moving its so terrible so being more careful is important but am anticipating lower prices in this market NAS100 Index, that's not calling it for anybody to short but that's what am thinking is going to happen, it's going to be a nice week ahead at Sunday opening and there we shall see where we want to roll to

NASDAQ100 SELL POTENTIAL!Looking at the market structure in US100 from the daily timeframe, we’re seeing a possible sell opportunity as price is beginning to form a distribution stage
Therefore, I anticipate a drop in price. A sell opportunity is envisaged

NASDAQ Short-Term Outlook (Study Purpose Only)The NASDAQ index is showing signs of short-term weakness following a rejection near the 22,000–22,200 resistance zone. The recent breakdown from the consolidation range suggests bearish sentiment is building.
🔻 Key Observations:
Stop Loss Zone: 22,192
Price should ideally remain below this level for a bearish setup to remain valid. A move above this zone may invalidate the downside scenario.
Immediate Support Level: 21,010
If selling pressure continues, this is the first potential bounce zone. Watch price behavior closely here.
Deeper Support Target: 20,223
A break below 21,000 could open the door for a drop toward the 20,200 area — a previous accumulation/support level.
⚠️ Risk Management:
Traders may consider this type of setup if looking for short positions, but only with tight risk controls and clear confirmation of trend continuation.
📝 Disclaimer:
This analysis is strictly for study and educational purposes. It is not financial advice or a recommendation to take a trading position. Please consult a licensed financial advisor before making any investment decisions.

Weekly Market Analysis for US100
OMFA Strategy. OMFA means Overcoming FOMO through Order, Mastery, Focus and Abundance!

sell to buystructure narrative.
order flow; weak swings and failed zones.
liquidity; sweeps and inducements.
point of interests: order blocks(+/-)


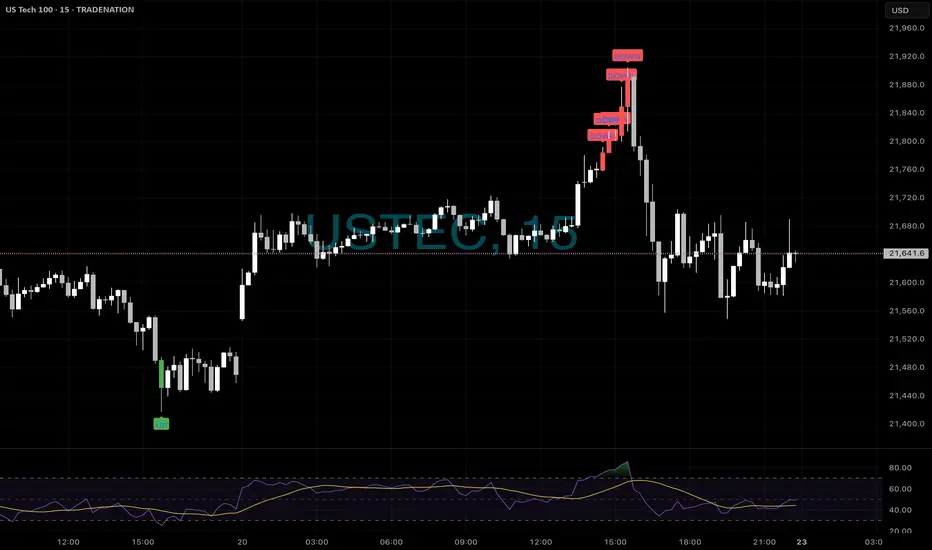
NASDAQ - Shorts📉 Perfect Friday Reversal Call – NAS100 15min
Another clean short setup from our ELFIEDT – X-REVERSION system on Friday’s rally top.
🟥 Just look at the stacked “DOWN” signals — not one, not two, but multiple confirmations printed right at the exhaustion high.
These are standalone signals, meaning you don’t need anything else to act — just place your stop above the signal candle and let price do the rest.
💡 Bonus: Notice how the RSI printed divergence just before the top?
This is how our system combines statistical reversion + momentum analysis — no fluff, no guesswork.
💬 If you’re tired of chasing trades and getting dumped on the wrong side of a move…
👉 It’s time you trade with logic, timing, and precision.
📲 Message us if you’re ready to use this indicator and start making money from real market structure and turning points.
We’ve shown it time and again — let the results speak.
⸻
#NAS100 #ReversalTrading #ShortSetup #ELFIEDT #SmartMoney #NoLag #TradingViewIndicators #TechnicalAnalysis #PriceAction #RSIDivergence #ReversionStrategy #FridayMoves #TradeTheTurn #EarnFromMarkets #ProToolsForTraders
NAS100 Bullish Breakout SetupNAS100 Bullish Breakout Setup 🚀
🧠 Chart Analysis (H4 timeframe)
🔹 Ascending Channel:
Price has been trending inside a clear ascending channel (blue zone), supported by higher highs and higher lows.
🔹 Support & Resistance:
Support: Around 21,635.32 – tested multiple times (highlighted by 🔵 arrows).
Resistance: Around 22,265.19 – recent highs and psychological barrier.
🔹 Double Bottom Formation 👣:
Near support zone, a potential double bottom (bullish reversal pattern) is visible. The neckline has been challenged.
🔹 Breakout Confirmation 🟢:
Price has broken above the descending neckline of the double bottom and is hovering near 21,644, indicating potential bullish continuation if sustained.
🔹 Target 🎯:
Projected breakout target lies at 22,265.19, aligning with the previous resistance zone.
🔹 Volume & Momentum 📊:
While not shown, a breakout above the neckline generally needs strong volume confirmation to validate the move.
📌 Conclusion:
If price sustains above the 21,635 – 21,644 area and gains momentum, the path to 22,265 looks likely ✅. However, a false breakout could drag the price back into the channel.

NAS100...Ever The Bullish Instrument (Part 41)We are entering week 12 since the market signaled it's lowest point of 2025...and the 2nd week of the upper level consolidation between the last Daily Low and the current daily High...
This was confirmed by the the daily consolidation point created by the lowest point of last week on Thursday at 9:49 am... (See M1 Chart)
The market then bought 4,700 for a nice consolidatory trend move in favor of the bulls.
This was followed up with a quick hard sell which is expected in consolidated market such as we have.
There will be lot's of great opportunities favoring buyers and sellers, however the main moves for me are always the buys from my largest HL and the market has proven that over the last 11 weeks the lows have been intact.
Just remember any sells in the market are only temporary retracements to another HL on the largest timeframe.
I do not react to news as the market only trades the defined structure...any craziness that happens in the world only creates volatility within an already established market structure.
So for this week...it's business as usual...I wait for my next entry at the HL just below 21449.0 or at the next confirmed HL.
Happy trading...
My strategy is and will always be:
HL's to HH's Guaranteed!
#oneauberstrategy

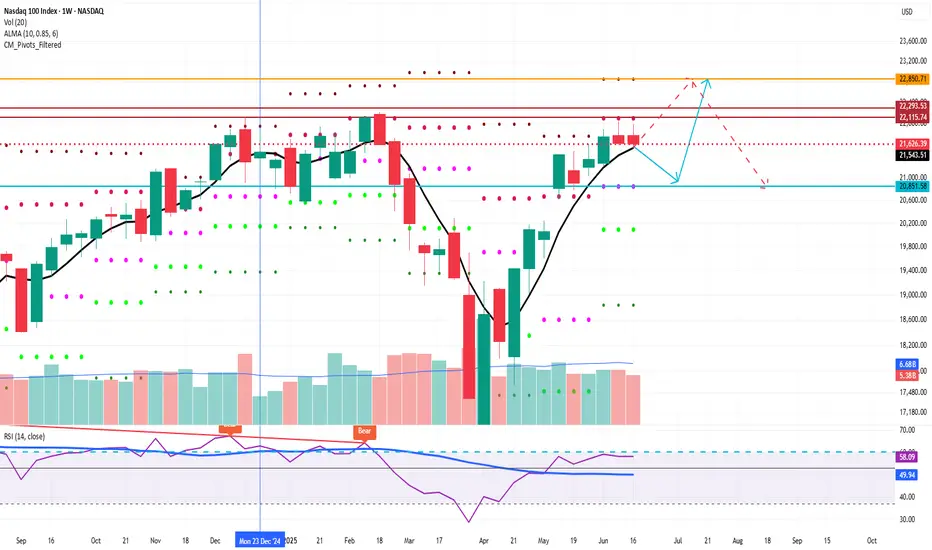
NASDAQ may retrace till 26850 before making an upmove NASDAQ may retrace till 26850 before making an upmove that can be round 22850 in next few weeks. This is a weekly chart.
This is not a recommendation, but a study.
Fractal to move UPAs you can see the fractal it seems like the price now so if that true we will se up movement before correction again to make new highs

NASDAQ Bullish Play into Liquidity Before Potential ReversalForecast:
NOTE: At this moment, this is a forecast and trades will be taken dependent on live PA.
Price has reacted strongly off the 21,410–21,430 Daily Order Block, suggesting bullish intent. If bullish structure holds, I expect a move into the 22,060–22,130 liquidity zone, where sell-side setups could form.
This is a classic Buy to Sell model:
Buy from OB at ~21,420
Target liquidity above recent highs (~22,100+)
Look for shorts after sweep into 22,130–22,220 range
Invalidation: Break and close below 21,410 suggests the OB failed — potential deeper drop toward 20,700.

NASDAQ READY TO CONTINUE THE LONG-TERM WEEKLY BULLISH RUN
FX:NAS100
I just entered this buy trade on Nasdaq on the daily time frame.
The trade setup is a Swing trade following the monthly and weekly orderflow.
The Monthly is bullish, the weekly is also bullish, so I entered on the daily time frame retracement.
My overall take profit is a risk reward of 1:4.

NASDAQ Potential UpsidesHey Traders, in the coming week we are monitoring NAS100 for a buying opportunity around 21,500 zone, NASDAQ is trading in an uptrend and currently is in a correction phase in which it is approaching the trend at 21,500 support and resistance area.
Trade safe, Joe.

NASDAQ Bread and Butter & Turtle Soup Example XIIaight, so im gonna break down a trade i took on nasdaq today using a setup i picked out myself from the ict concepts. just my own flavor of it, ya know
before i knock out at night, i open up the charts real quick — just tryna see if there's any clean liquidity chillin’ nearby. if there aint, i shut it down and catch some solid sleep. but if there is... bingo baby
this basically means i might just wake up rich tomorrow, bro. on the daily, im seeing two strong green days back to back, and right above that boom some equal highs just sitting there, begging to get run. they are even cleaner on the 1h. bias locked in. im waking up tomorrow and hunting longs, simple as that.
i mark up the daily open first thing. if im lookin for longs, i wanna see some turtle soup under the open. if im hunting shorts, i need that setup above the open. thats just how i roll.
if there is a swing low, trend liquidity, or some equal lows carryin over from yesterday, im locked in on those levels for turtle soup. if not, im just chillin, waitin for price to build some fresh liquidity during the day and then snatch it.
in this setup, i got some leftover liquidity from yesterday plus a clean 4h fvg sittin there like a neon sign.
next, i check the time. liquidity grabs usually hit during one of the killzones depends on the pair, but im watchin asia, london, or new york sessions.
then i scope out if there is any news droppin around that time, especially stuff that could move the pair. no point in getting blindsided.
and yeah, i always peep correlated pairs too sometimes they snitch before your chart even says a word.
when all the stars and planets line up just right, that is when I drop down to the 15m and wait for a clean csd to show up. but here is the thing i dont jump in the second i see it. i wanna see price actually leave the liquidity zone.
yeah, it might lower my rr a bit, but the win rate goes way up. It keeps me outta those fake-ass turtle soups that look good at first but just wanna wreck your stop.
once im in the trade, i usually try to close out half the position the same day take profits where the chance of price reversing is damn near zero. then i let the other half ride toward my target liquidity. just lettin it breathe, do its thing.
thats it, peace out
