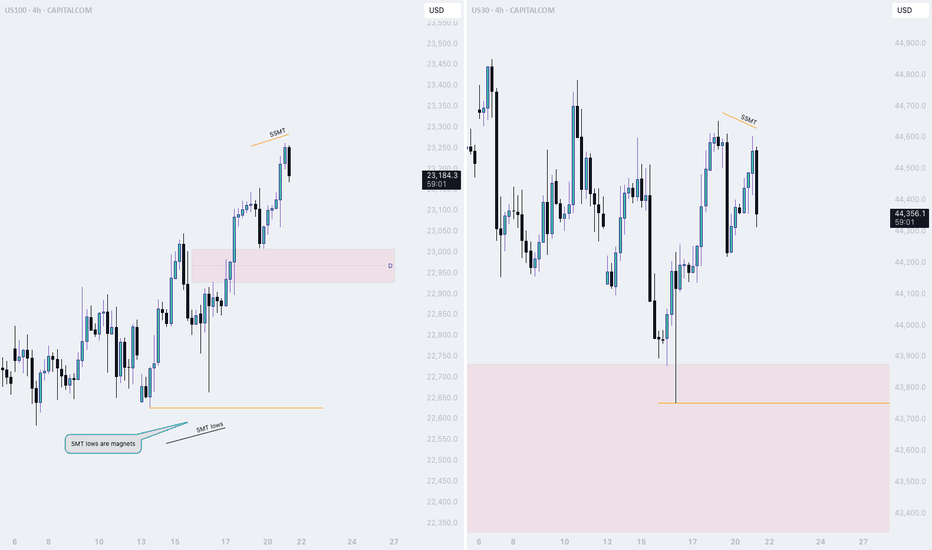
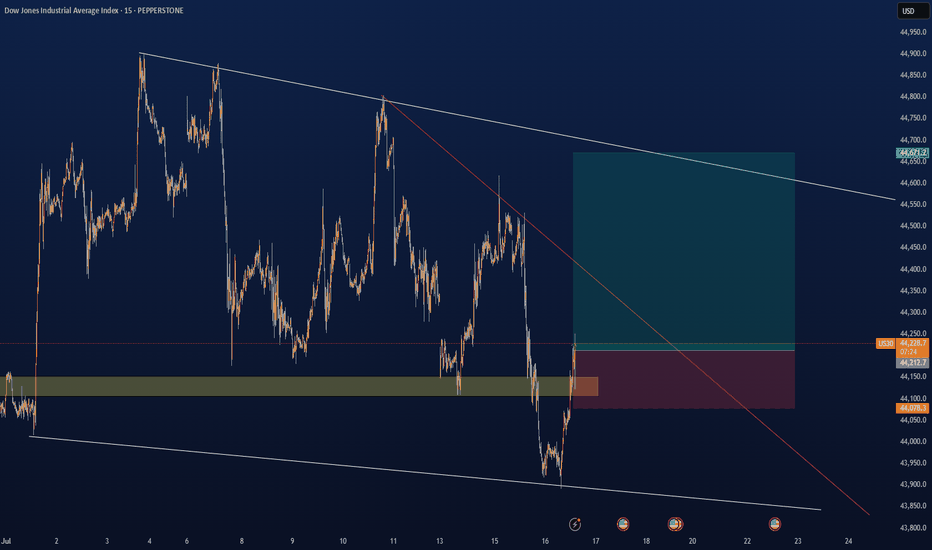
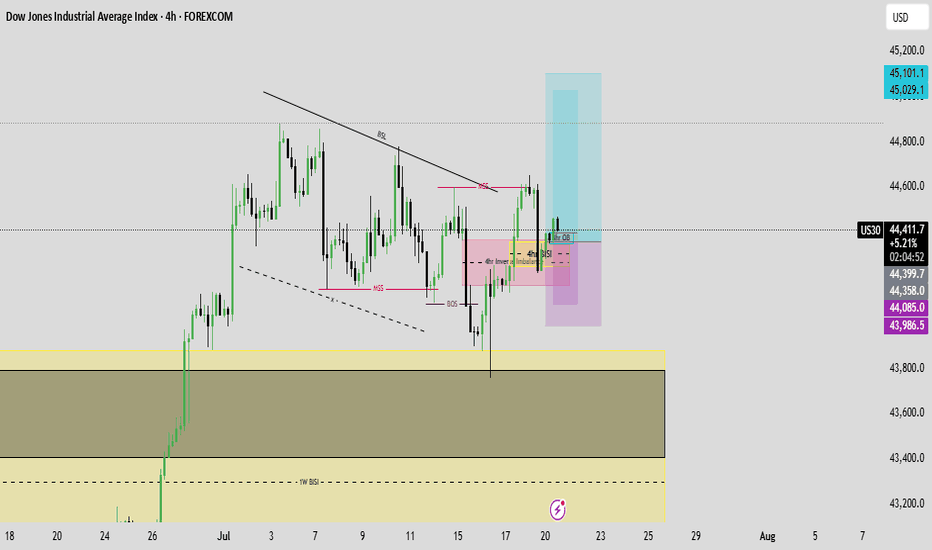
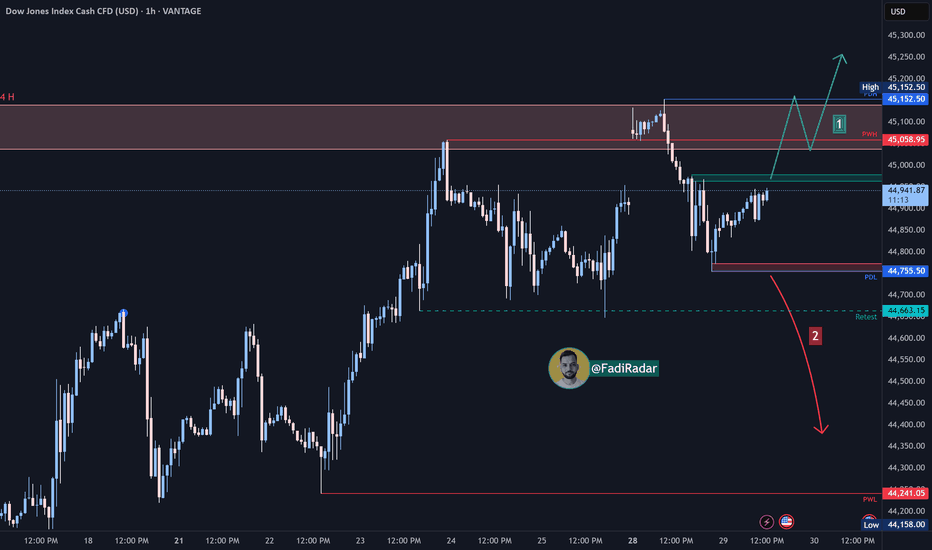
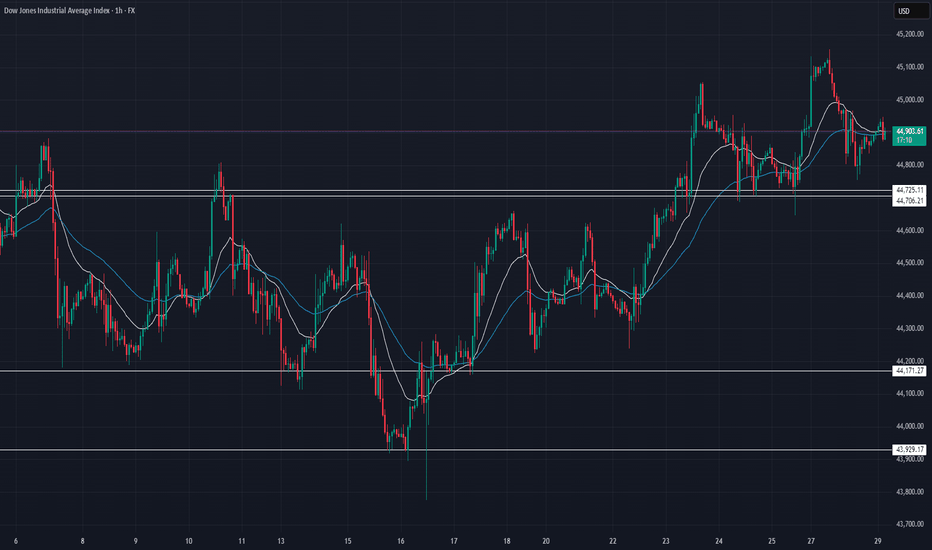
US30News came out positive today from both the PPI and Jobless Claims so i believe we might see US30 going back to the 45.000 demand area which its been respecting these past few weeks.Longby marcialago110
US Wall St 30Dow Jones Market Analysis Introduction Hello dear traders! In this analysis, we will examine the status of the Dow Jones chart in the one-hour timeframe. Technical Analysis The Dow Jones chart is currently in a bearish phase, but it has provided us with a bullish confirmation. Based on this, we can hold a buy position (Buy Position) until the one-hour liquidity. Key Levels Liquidity 1H: 44662.2 Secret Order Block: 44792 Ideal Time to Buy with Confirmation: 43783 Conclusion My analysis is very simple and straightforward so that you can easily utilize it. Considering the mentioned key levels, you can make your trading decisions. Wishing you all success! Fereydoon Bahrami A retail trader in the Wall Street Trading Center (Forex) Risk Disclosure: Trading in the cryptocurrency market is risky due to high price volatility. This analysis is solely my personal opinion and should not be considered financial advice. Please do your own research. You are responsible for any profits or losses resulting from this analysis.Longby fereydoon11993
Dow awaits US inflation reportThe Dow (US30) index price action sentiment appears bullish, supported by the longer-term prevailing uptrend. However, since reaching an all-time high on 04th December 2024 the Dow index price action is consolidating in a sideways trading range. The key trading level is at 44206, which is the current swing low. A corrective pullback from the current levels and a bullish bounce back from the 44206 level could target the upside resistance at 44980 followed by the 44080 and 44200 levels over the longer timeframe. Alternatively, a confirmed loss of 44206 support and a daily close below that level would negate the bullish outlook opening the way for a further retracement and a retest of 44000 support level followed by 43740. This communication is for informational purposes only and should not be viewed as any form of recommendation as to a particular course of action or as investment advice. It is not intended as an offer or solicitation for the purchase or sale of any financial instrument or as an official confirmation of any transaction. Opinions, estimates and assumptions expressed herein are made as of the date of this communication and are subject to change without notice. This communication has been prepared based upon information, including market prices, data and other information, believed to be reliable; however, Trade Nation does not warrant its completeness or accuracy. All market prices and market data contained in or attached to this communication are indicative and subject to change without notice.by TradeNation3
US30 Will Go Up From Support! Buy! Take a look at our analysis for US30. Time Frame: 4h Current Trend: Bullish Sentiment: Oversold (based on 7-period RSI) Forecast: Bullish The market is approaching a significant support area 44,546.65. The above-mentioned technicals clearly indicate the dominance of sellers on the market. I recommend shorting the instrument, aiming at 45,015.58 level. P.S Overbought describes a period of time where there has been a significant and consistent upward move in price over a period of time without much pullback. Like and subscribe and comment my ideas if you enjoy them!Longby SignalProvider333
DOW JONES is completing a Bull Flag to jump to 46700.Dow Jones / US30 is posting a Bull Flag pattern on the 4hour timeframe, currently between the 4hour MA50 and MA200. The last time we came across this pattern was with the early September Bull Flag. Both patterns started after a +8.20% rise on the index. If the new one repeats September's, then we should see an immediate rally to the 1.5 Fibonacci. Buy and target 46700. Follow us, like the idea and leave a comment below!!Longby TheCryptagon6
US30 Bullish Breakout! HI,Traders ! US30 was trading in a Narrowing wedge pattern But now we are seeing a Bullish breakout so we Will be expecting a Further bullish move up! Comment and subscribe to help us grow ! Shortby kacim_elloitt114
Dow (US30) coiling price action after increase in US PPI dataThe Dow (US30) index price action sentiment appears bullish, supported by the longer-term prevailing uptrend. However, since reaching an all-time high on 04th December 2024 the Dow index price action is consolidating in a sideways trading range. Today, Thursday 13th February 2025 the US (PPI) Producer Price Index data was published showing the increase to 3.5% on a yearly basis in January. The annual core PPI rose to 3.6% in the same period, surpassing market forecasts of 3.3%. On a monthly basis, the PPI and the core PPI rose 0.4% and 0.3%, respectively. The key trading level is at 44206, the current swing low. A corrective pullback from the current levels and a bullish bounce back from the 44206 level could target the upside resistance at 44980 followed by the 45080 and 45200 levels over the longer timeframe. Alternatively, a confirmed loss of 44206 support and a daily close below that level would negate the bullish outlook opening the way for a further retracement and a retest of 44000 support level followed by 43740. This communication is for informational purposes only and should not be viewed as any form of recommendation as to a particular course of action or as investment advice. It is not intended as an offer or solicitation for the purchase or sale of any financial instrument or as an official confirmation of any transaction. Opinions, estimates and assumptions expressed herein are made as of the date of this communication and are subject to change without notice. This communication has been prepared based upon information, including market prices, data and other information, believed to be reliable; however, Trade Nation does not warrant its completeness or accuracy. All market prices and market data contained in or attached to this communication are indicative and subject to change without notice. by TradeNation4
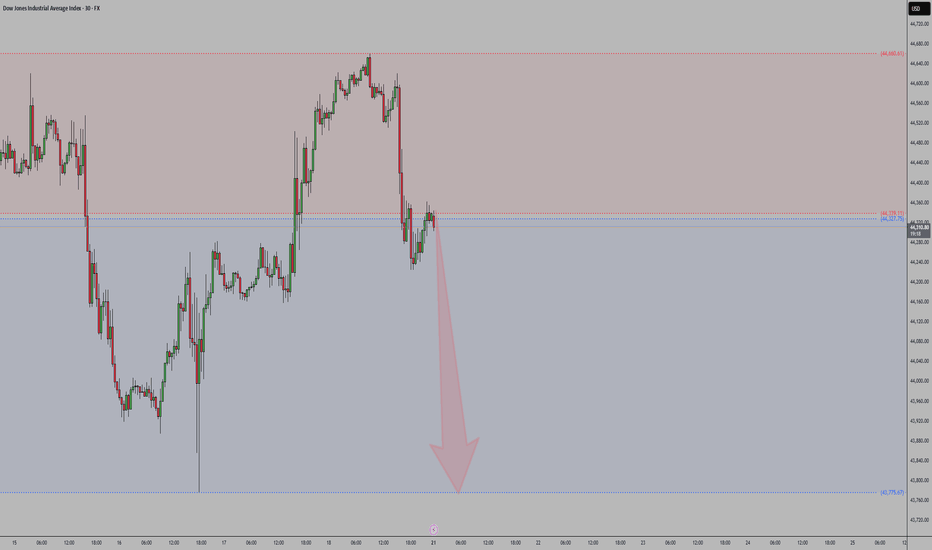
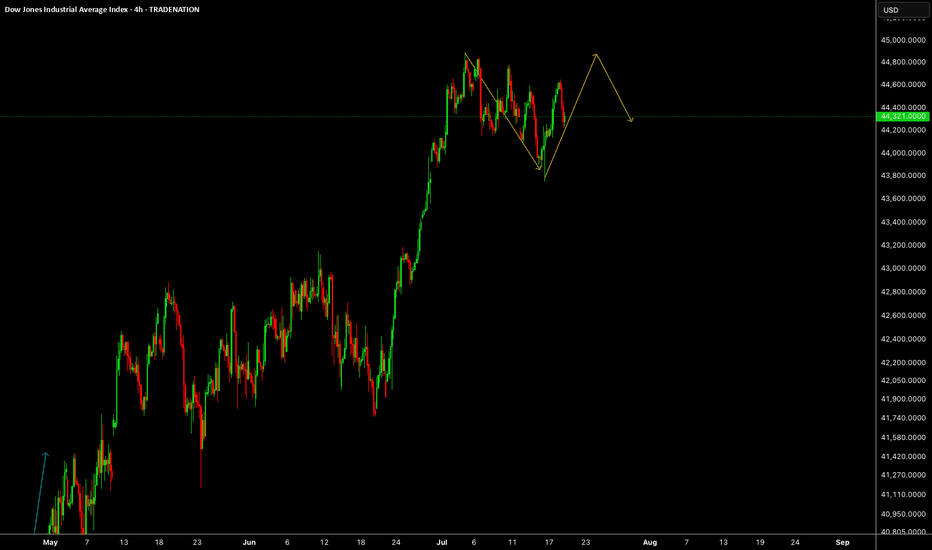
Be ready to sellProbably, from the range of 44500, it will start to create a downward trend in.The downward trend has started.by ehsanjan31
DJI has created a short-term peak.DJI may fall to the 42,000. Investors should consider reducing their positions to a safer level. This is a scenario to consider, not an investment recommendation.by maivietduc0912913
US30 in consolidation/low volatility watch the BullsUS30 may be providing an opportunity for a bullish move. Keep your eye out at the current level. Long11:03by leslyjeanbaptiste3
"US30/DJ30" Indices CFD Market Bearish Heist Plan🌟Hi! Hola! Ola! Bonjour! Hallo!🌟 Dear Money Makers & Robbers, 🤑 💰🐱👤🐱🏍 Based on 🔥Thief Trading style technical and fundamental analysis🔥, here is our master plan to heist the "US30/DJ30" Indices CFD Market. Please adhere to the strategy I've outlined in the chart, which emphasizes short entry. Our aim is the high-risk Green Zone. Risky level, oversold market, consolidation, trend reversal, trap at the level where traders and bullish thieves are getting stronger. 🏆💸Book Profits Be wealthy and safe trade.💪🏆🎉 Entry 📈 : "The heist is on! Wait for the breakout (44,000.0) then make your move - Bearish profits await!" however I advise placing Sell Stop Orders below the breakout MA or Place Sell limit orders within a 15 or 30 minute timeframe. Entry from the most recent or closest low or high level should be in retest. Stop Loss 🛑: Thief SL placed at 44,600.0 (swing Trade Basis) Using the 4H period, the recent / swing high or low level. SL is based on your risk of the trade, lot size and how many multiple orders you have to take. Target 🎯: 43,000.0 (or) Escape Before the Target 🧲Scalpers, take note 👀 : only scalp on the Short side. If you have a lot of money, you can go straight away; if not, you can join swing traders and carry out the robbery plan. Use trailing SL to safeguard your money 💰. 📰🗞️Fundamental, Macro, COT, Sentimental Outlook: "US30/DJ30" Indices CFD Market is currently experiencing a Bearish trend., driven by several key factors. ⚪Fundamental Analysis The US30 index is influenced by the overall performance of the US economy, including GDP growth rate, inflation, and interest rates. Currently, the US economy is experiencing a moderate growth rate, with a slight increase in inflation. 🔴Macroeconomic Analysis The Federal Reserve has maintained a hawkish stance, with interest rates expected to remain high in the short term. This has led to a strengthening of the US dollar, which may impact the US30 index. 🟢COT Data Analysis The Commitments of Traders (COT) report shows that commercial traders are net short, while non-commercial traders are net long. This indicates a potential trend reversal. 🟡Sentimental Analysis Market sentiment is slightly bearish, with 55% of traders holding short positions. 🟤Positioning Data Analysis Institutional traders are holding short positions, while corporate traders are holding long positions. Banks are maintaining a bearish stance. 🔵Market Sentiment - Institutional Traders: 60% bearish, 40% bullish - Hedge Funds: 70% bearish, 30% bullish - Retail Traders: 55% bullish, 45% bearish 🟣Overall Outlook The US30 index is expected to remain volatile in the short term, with a slight bearish bias due to the hawkish stance of the Federal Reserve. However, the index's movement will largely depend on the overall performance of the US economy and global economic trends. ⚠️Trading Alert : News Releases and Position Management 📰 🗞️ 🚫🚏 As a reminder, news releases can have a significant impact on market prices and volatility. To minimize potential losses and protect your running positions, we recommend the following: Avoid taking new trades during news releases Use trailing stop-loss orders to protect your running positions and lock in profits 📌Please note that this is a general analysis and not personalized investment advice. It's essential to consider your own risk tolerance and market analysis before making any investment decisions. 📌Keep in mind that these factors can change rapidly, and it's essential to stay up-to-date with market developments and adjust your analysis accordingly. 💖Supporting our robbery plan will enable us to effortlessly make and steal money 💰💵 Tell your friends, Colleagues and family to follow, like, and share. Boost the strength of our robbery team. Every day in this market make money with ease by using the Thief Trading Style.🏆💪🤝❤️🎉🚀 I'll see you soon with another heist plan, so stay tuned 🤑🐱👤🤗🤩Shortby Thief_TraderUpdated 3
DOW JONES: Necessary correction to lated target 46,600.Dow Jones is neutral on its 1D technical outlook (RSI = 53.301, MACD = 170.540, ADX = 30.319) as it is trading sideways on top of the 1D MA50 for the past 2 weeks. The long term pattern is a Channel Up that every time it rebounded on a HL bottom and hit the R1, it always pulled back again to test the 1D MA50. Consequently, this is a necessary technical correction that will allow the index to attract enough buying momentum again to go after a new HH. Aim for a minimum +8.41% increase (TP = 46,600). ## If you like our free content follow our profile to get more daily ideas. ## ## Comments and likes are greatly appreciated. ##Longby InvestingScope13
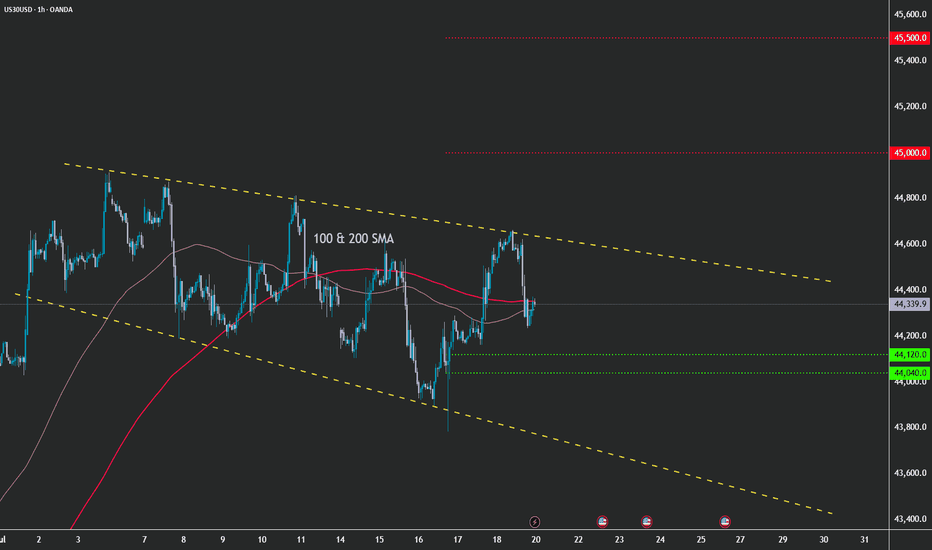
Bullish rise?Dow Jones (US30) has reacted off the pivot and could potentially rise to the pullback resistance. Pivot: 44,449.91 1st Support: 43,945.23 1st Resistance: 45,014.39 Risk Warning: Trading Forex and CFDs carries a high level of risk to your capital and you should only trade with money you can afford to lose. Trading Forex and CFDs may not be suitable for all investors, so please ensure that you fully understand the risks involved and seek independent advice if necessary. Disclaimer: The above opinions given constitute general market commentary, and do not constitute the opinion or advice of IC Markets or any form of personal or investment advice. Any opinions, news, research, analyses, prices, other information, or links to third-party sites contained on this website are provided on an "as-is" basis, are intended only to be informative, is not an advice nor a recommendation, nor research, or a record of our trading prices, or an offer of, or solicitation for a transaction in any financial instrument and thus should not be treated as such. The information provided does not involve any specific investment objectives, financial situation and needs of any specific person who may receive it. Please be aware, that past performance is not a reliable indicator of future performance and/or results. Past Performance or Forward-looking scenarios based upon the reasonable beliefs of the third-party provider are not a guarantee of future performance. Actual results may differ materially from those anticipated in forward-looking or past performance statements. IC Markets makes no representation or warranty and assumes no liability as to the accuracy or completeness of the information provided, nor any loss arising from any investment based on a recommendation, forecast or any information supplied by any third-party. Longby ICmarkets3
Trendline BreakInitially the price made a double top followed by the price breaking a bullish Trendline and made a pullback, now the price looks to continue the bearish move WE ONLY TRADE PULLBACKSShortby KenyanAlphaUpdated 5
US30 Awaits CPI – Breakout or Breakdown?🚀 US30 Technical Analysis – CPI Impact in Focus The US30 index remains within a descending channel, reacting around the pivot level at 44,404. The upcoming CPI report is expected to bring high volatility, as inflation data will influence the Fed's rate outlook and market sentiment. 📉 CPI Impact & Bearish Scenario: - If CPI remains high or meets expectations (above 2.9%), the Fed is less likely to ease policy, leading to negative pressure on indices. - A rejection from 44,575 would confirm bearish movement. - A break below 44,404 will trigger a drop toward 43,763, confirming bearish continuation. If 43,763 fails to hold, further downside targets are 43,212 and 42,769. 📈 CPI Impact & Bullish Scenario: - If CPI drops below expectations (<2.9%), markets may rally on rate-cut hopes, pushing US30 higher. - Holding above 44,404 could drive price toward 44,575. - A breakout above 44,756 would invalidate the bearish setup, targeting 45,099 and beyond. Key Levels Pivot Line 44575 Resistance lines: 44756, 44925, 45100 Support Lines: 44404, 44230, 43890 Trend Outlook: Bearish if CPI remains high (≥2.9%) & price stays below 44,404 📉 Bullish if CPI drops below expectations (<2.9%) & price holds above 44,756 🚀 💬 Will US30 break down or push higher? Drop your thoughts below! 👇🔥Shortby SroshMayiUpdated 9
US30 - Technical Analysis by GivenLooking at the US30 for the remainder of the month, we are likely to see a bearish us30 Shortby Givenmkh2
US30 4H - ATHDow Jones Index Analysis Introduction: As always, further analysis is required. Two possible bullish movement scenarios have been discussed, with a target of breaking the highest price (ATH). Plan C: Scenario: A potential drop to 44350, followed by a reversal in the main direction towards the ATH target at 47180. Condition: This scenario is more likely if there is high volume and strong buyer power. Plan A: Scenario: A drop to 44350, followed by a temporary upward movement to the marked range around 45200. Correction: Afterward, a temporary market correction to 43570. Main Target: A reversal back to the upward trend with the goal of breaking the ATH. Likelihood: This plan seems more probable in my opinion. Conclusion: Both plans suggest the potential for breaking the ATH, but Plan A is the more likely scenario. High-accuracy analysis, amazing results!Longby GreyFX-NDSUpdated 5594
Potential bearish dropDJ30 is rising towards the resistance level that is an overlap resistance and could drop from this level to our take profit. Entry: 44,603.74 Why we like it: There is an overlap resistance level. Stop loss: 45,112.98 Why we like it: There is a pullback resistance level. Take profit: 43,871.19 Why we like it: There is an overlap support level.Shortby Disco-DaveUpdated 4
The price is showing signs of a potential bearish moveAfter a minor pullback, further downside momentum is expected. Watching for confirmation before entering short positions.Shortby EhsanFibo3
chcek the trendIt is expected that after some correction, a trend change will form and we will see the start of the upward trend. If the support area is broken, the continuation of the downward trend will be likely.by STPFOREX1
US30/DJ30 "Dow Jones Industrial Average" Indices Heist Plan🌟Hi! Hola! Ola! Bonjour! Hallo!🌟 Dear Money Makers & Robbers, 🤑 💰 Based on 🔥Thief Trading style technical and fundamental analysis🔥, here is our master plan to heist the US30 / DJ30 "Dow Jones Industrial Average" Indices market. Please adhere to the strategy I've outlined in the chart, which emphasizes long entry and short entry. 🏆💸Be wealthy and safe trade.💪🏆🎉 Entry 📈 : "The loot's within reach! Wait for the breakout, then grab your share - whether you're a Bullish thief or a Bearish bandit!" Buy entry above 44,660.0 Sell Entry below 43,800.0 Stop Loss 🛑: Thief SL placed at 44,100.0 (swing Trade) for Bullish Trade Thief SL placed at 44,100.0 (swing Trade) for Bearish Trade Using the 2H period, the recent / nearest low or high level. SL is based on your risk of the trade, lot size and how many multiple orders you have to take. Target 🎯: -Bullish Robbers TP 46,200.0 (or) Escape Before the Target -Bearish Robbers TP 42,600.0 (or) Escape Before the Target 📰🗞️Fundamental, Macro, COT, Sentimental Outlook: US30 / DJ30 "Dow Jones Industrial Average" Indices market is currently experiencing a Neutral trend (there is a higher chance for Bullish)., driven by several key factors. 🟣 Fundamental Analysis - Earnings Growth: The Dow Jones 30 (DJ30) companies have reported strong earnings growth, with an average increase of 10% in the last quarter. - Dividend Yield: The DJ30 has a dividend yield of 2.1%, which is relatively attractive compared to other asset classes. - Valuation: The DJ30 is trading at a price-to-earnings (P/E) ratio of 18.5, which is slightly above its historical average. ⚪ Macro Analysis - Interest Rates: The US Federal Reserve has kept interest rates steady, which is positive for equities. - Inflation: Inflation remains under control, with the Consumer Price Index (CPI) increasing by 2.3% in the last year. - GDP Growth: The US GDP growth rate is expected to slow down to 2.1% in 2023, which is still positive for equities. 🔴 Sentimental Analysis - Trader Sentiment: 55% of traders are bullish on DJ30, while 30% are bearish and 15% are neutral. - Investor Sentiment: The AAII Investor Sentiment Survey shows that 44.5% of investors are bullish, while 24.5% are bearish. - Hedge Fund Sentiment: Hedge funds have increased their long positions in DJ30, with a net long exposure of 25%. 🟠 COT Analysis - Non-Commercial Traders: Net long 35,019 contracts (Increase of 5,011 contracts from last week) - Commercial Traders: Net short 25,011 contracts (Decrease of 2,011 contracts from last week) - Leverage: Average leverage used by traders is 8:1 🟡 Institutional Traders - Goldman Sachs: Net long 20,109 contracts (Increase of 3,011 contracts from last week) - Morgan Stanley: Net long 15,011 contracts (Decrease of 1,011 contracts from last week) - JPMorgan Chase: Net long 18,011 contracts (Increase of 2,011 contracts from last week) 🟢 Hedge Funds - Bridgewater Associates: Net long 30,109 contracts (Increase of 5,011 contracts from last week) - BlackRock: Net long 25,011 contracts (Decrease of 2,011 contracts from last week) - Vanguard: Net long 20,011 contracts (Increase of 3,011 contracts from last week) 🟤 Overall Outlook Based on the analysis, the DJ30 (US30) is expected to move in a bullish trend, with a 60% chance of an uptrend and a 30% chance of a downtrend. The remaining 10% chance is for a neutral trend. ⚠️Trading Alert : News Releases and Position Management 📰 🗞️ 🚫🚏 As a reminder, news releases can have a significant impact on market prices and volatility. To minimize potential losses and protect your running positions, we recommend the following: Avoid taking new trades during news releases Use trailing stop-loss orders to protect your running positions and lock in profits 📌Please note that this is a general analysis and not personalized investment advice. It's essential to consider your own risk tolerance and market analysis before making any investment decisions. 📌Keep in mind that these factors can change rapidly, and it's essential to stay up-to-date with market developments and adjust your analysis accordingly. 💖Supporting our robbery plan will enable us to effortlessly make and steal money 💰💵 Tell your friends, Colleagues and family to follow, like, and share. Boost the strength of our robbery team. Every day in this market make money with ease by using the Thief Trading Style.🏆💪🤝❤️🎉🚀 I'll see you soon with another heist plan, so stay tuned 🤗by Thief_TraderUpdated 2
US30The US30 (Dow Jones Industrial Average) is influenced by economic factors, including interest rates. Changes in interest rates can affect the stock market quickly. Rising interest rates typically hurt stock performance. When interest rates increase, it becomes more expensive for consumers and businesses to borrow money, potentially leading them to cut back on spending. This can cause earnings to fall and, consequently, stock prices to drop. Additionally, higher interest rates can lead individuals to prefer the higher returns on savings accounts over the risks associated with investing in stocks, Conversely, when interest rates decrease, borrowing becomes cheaper, encouraging consumer and business spending and investment. This can lead to increased demand and rising stock prices. Lower interest rates can also cause investors to shift money from the bond market to the stock market in pursuit of greater opportunities, further boosting stock prices. The US30 is heavily influenced by economic factors such as interest rates, inflation, and government policies. Inverse Correlation with the Dollar: The US30 has many large multinational exporters; therefore, its price often fluctuates inversely with the value of the dollar. The anticipation of rising or falling interest rates can also influence market behavior and sentiment. Businesses and consumers may adjust their spending and investment decisions in anticipation of these changes, impacting earnings and stock prices. It's crucial to consider broader economic influences beyond interest rates when assessing the US303. The US30 only reflects a fraction of the entire US stock market.The US30 (Dow Jones Industrial Average) and the S&P 500 are both key indicators of the U.S. stock market, but they have several important distinctions. Key Differences: Number of Companies: The US30 tracks 30 large, blue-chip companies, while the S&P 500 includes 500 of the largest U.S. companies. The S&P 500's larger sample size is considered by some investors to provide a more accurate picture of the overall economy. Composition: The US30 represents companies based only in the U.S. and reflects the U.S. economy, businesses, and consumption trends2. The S&P 500 includes leading corporations across approximately 11 sectors. Weighting Methodology: The US30 is a price-weighted index, meaning that stocks with higher prices have a greater influence on the index value. The S&P 500, however, is weighted by market capitalization. Volatility: The US30 is generally less volatile compared to other indices, but also less diversified. The S&P 500 offers a balance of both growth and value stocks across diverse sectors, smoothing out volatility. Selection Criteria: Stocks are added to the US30 by a special Dow committee based on reputation, sustained growth, and interest to a large number of investors. The S&P 500 adds stocks based on a formula. Sector Focus: The S&P 500 is diversified across 11 sectors, while the US30 covers a handful of sectors. Market Representation: The S&P 500 covers nearly 80% of the market capitalization of U.S. stock exchanges.12:44by Shavyfxhub1
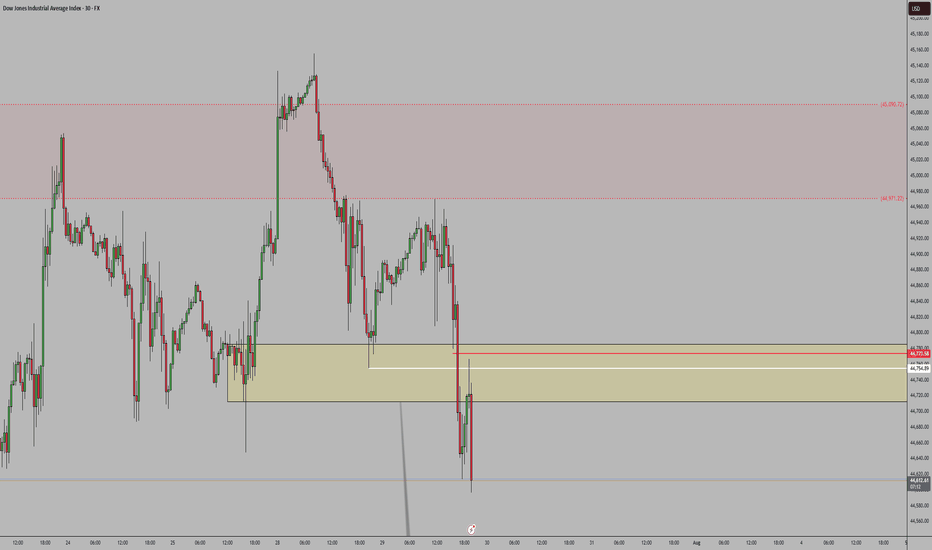
Potential dropAs long as the price is under 45000, and fails to break this barrier the indice will likely be bearish. Shortby Two4One43