Dollar I Weekly CLS I Model 2 I Ready for pullbackYo Market Warriors ⚔️
Fresh outlook drop — if you’ve been riding with me, you already know:
🎯My system is 100% mechanical. No emotions. No trend lines. No subjective guessing. Just precision, structure, and sniper entries.
🧠 What’s CLS?
It’s the real smart money. The invisible hand behind $7T/day — banks, algos, central players.
📍Model 1:
HTF bias based on the daily and weekly candles closes,
Wait for CLS candle to be created and manipulated. Switch to correct LTF and spot CIOD. Enter and target 50% of the CLS candle.
For high probability include Dealing Ranges, Weekly Profiles and CLS Timing.
Trading is like a sport. If you consistently practice you can learn it.
“Adapt what is useful. Reject whats useless and add whats is specifically yours.”
David Perk aka Dave FX Hunter
💬 Don't hesitate to ask any questions or share your opinions
USDX trade ideas

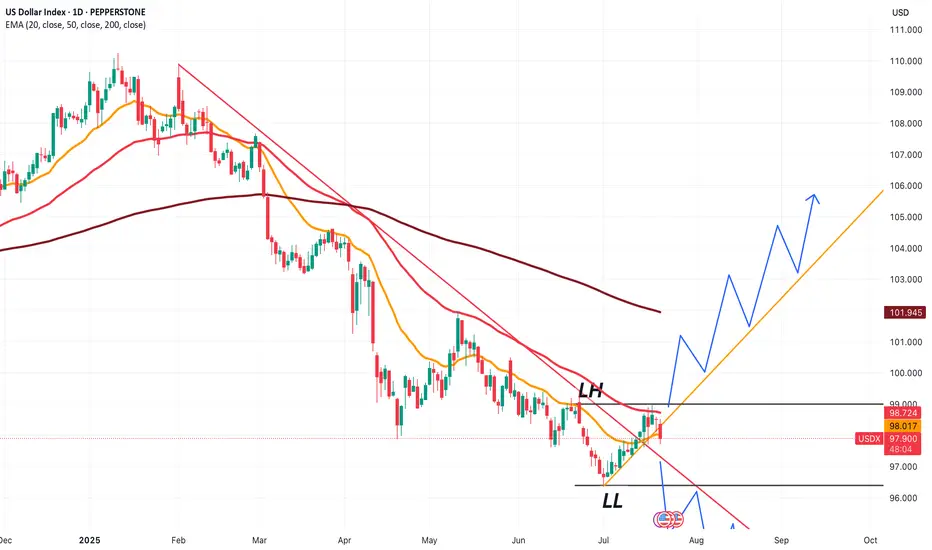
USDX at a crucial price point, which will decide trendThe next few candles for USDX price will be extremely important to understand where the dollar index is headed.
Based on that, we'll be able to choose 'which' Forex pairs we can trade, and more importantly 'how' we can trade them.
If price starts to follow the green line, and takes out 99.000, we'll be in an uptrend.
If price goes back to the red line and eventually goes below 96.400, we'll be in a downtrend.
Hopefully price won't consolidate too much, and trend in a particular direction.
USD Is Still Bullish! Wait For Buys!Welcome back to the Weekly Forex Forecast for the week of July 21-25th.
In this video, we will analyze the following FX market:
USD
The DXY has run bullish last week, up into an area of Supply, where the momentum hesitates now. Next week may pull back a bit... before continuing higher to the buy side liquidity.
Look out for the short term pullback to the W +FVG for a high probability move higher!
Enjoy!
May profits be upon you.
Leave any questions or comments in the comment section.
I appreciate any feedback from my viewers!
Like and/or subscribe if you want more accurate analysis.
Thank you so much!
Disclaimer:
I do not provide personal investment advice and I am not a qualified licensed investment advisor.
All information found here, including any ideas, opinions, views, predictions, forecasts, commentaries, suggestions, expressed or implied herein, are for informational, entertainment or educational purposes only and should not be construed as personal investment advice. While the information provided is believed to be accurate, it may include errors or inaccuracies.
I will not and cannot be held liable for any actions you take as a result of anything you read here.
Conduct your own due diligence, or consult a licensed financial advisor or broker before making any and all investment decisions. Any investments, trades, speculations, or decisions made on the basis of any information found on this channel, expressed or implied herein, are committed at your own risk, financial or otherwise.

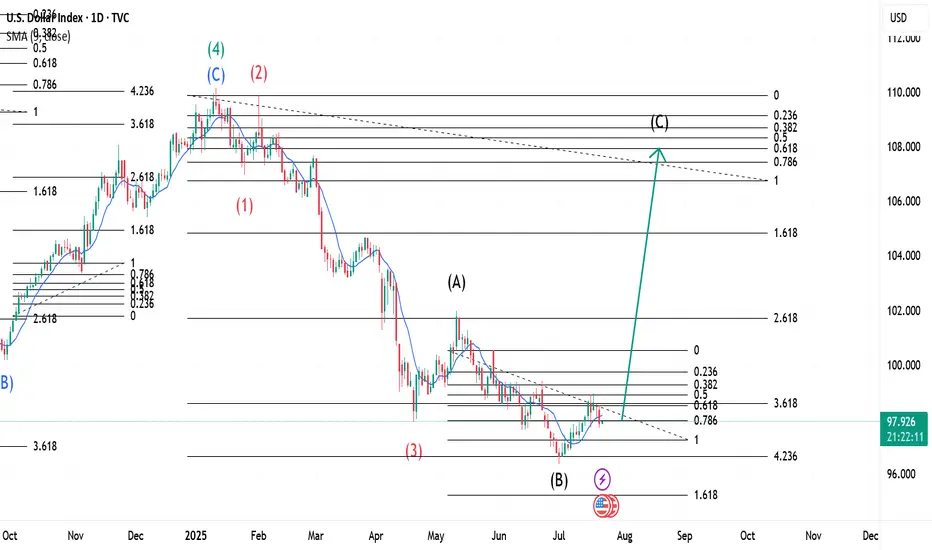
The $ Index ~ Elliott Wave Theory in real time.This is an update of a previously uploaded Dollar index Chart. Analysis remains the same and a confirmation at its current location would trigger continuation of the upward move as analysed on the first chart I had posted. Theoretically, the pullback on Monday, 21st July 2025 could be our Wave 2 with Wave 1 being on Thursday, 17th July 2025.
DXYThe latest COT data shows net short positions increasing on the U.S. Dollar, indicating a bearish sentiment from institutional traders. A rising short bias suggests weakening confidence in the dollar’s strength across major currencies.

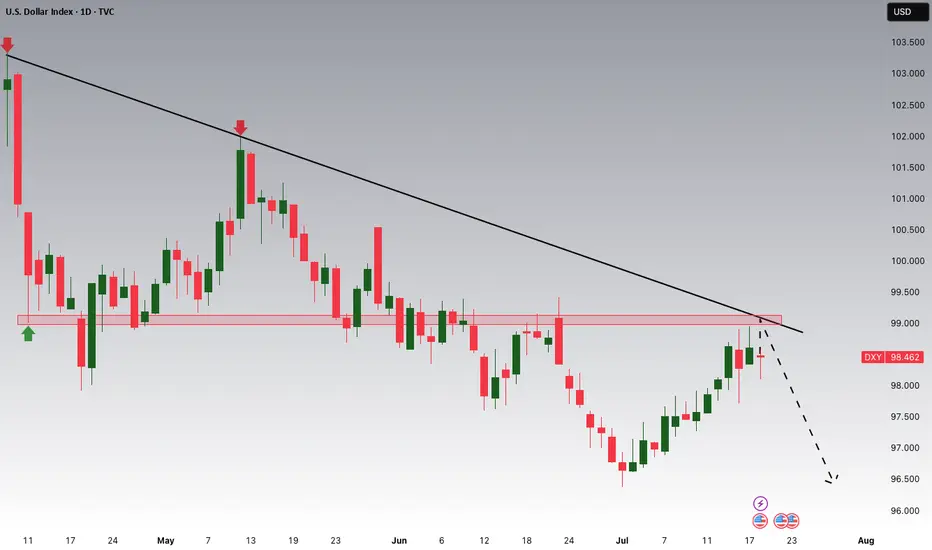
Dollar Index (DXY): Strong Bearish Price Action
Dollar Index broke and closed below a support line
of a bullish flag pattern on a daily.
Because the market is trading in a bearish trend,
this violation provides a strong bearish signal.
I expect a bearish movement to 96.75
❤️Please, support my work with like, thank you!❤️

DXY Sell breakdown from bullish trend selling pressure 📊DXY – US Dollar Index Analysis – 4H Timeframe
The US Dollar Index has broken its bullish trend with a strong bearish candle, signaling a possible shift in momentum to the downside
📍 Sell Position Active:
Entry taken at 98.000 following the trendline break and bearish confirmation candle
🎯 Technical Targets /
Demand Zones:
🔹 97.300 – near-term demand zone
🔹 96.500 – key support area to watch for potential reaction
🧠Momentum favors bears after structure break — monitoring price action as we approach target zones
What’s your outlook for DXY? Drop your analysis
👍 Like | 🔔 Follow | 💭 Comment for more updates
#usdollar #dxy

DXY HEADING INTO LAST WEEK OF JULY DXY ZONES
WEEKLY TF, TO DAILY, TO 4HR ANALYSIS.
The successful devaluation of the dollar by the administration since the election continues.
DXY dumped below key daily support at 97.600.
It was reclaimed but failed at key daily resistance dating back to 2024 — the same zone as the 0.382 Fibonacci level.
Failure to gain support at 97.580 (0.23 Fib level) = a bearish signal for the dollar index (DXY), potentially sending it back down to the 97.100–97.200 range. If that breaks, look for a further continuation toward the 96.700–96.800 zone.
This is a big week for news, reports, and interest rate decisions for the U.S., EUR, and CAD, as we close out July.
Still bearish on DXY for now.
However, if the dollar can break through the 97.950–98.000 range and catch support — then push past the 98.135–98.200 zone (0.618 Fib level) — I’ll be looking for a long entry on DXY up to the 98.900–99.400 zone for the next test.
Again, I remain bearish for now, but depending on the data and what the Fed does with U.S. rates, we could see a strong DXY this week. Until we pass those zones, I’m staying bearish.
New to trading (6 months in) — before you leave any hate comments:
I’m here to learn and would genuinely appreciate any advice or help in becoming better and more thorough.

DXY Potential DownsidesHey Traders, in the coming week we are monitoring DXY for a selling opportunity around 99.000 zone, DXY is trading in a downtrend and currently is in a correction phase in which it is approaching the trend at 99.000 support and resistance area.
Trade safe, Joe.
Dollar. When King of cash said : I'm still the king. 23/July/25DXY. when Dollar = the king of cash said : "Cash is King!" AND as a King of cash I'm RECLAIMING MY CROWN.. What will happen to "all equities market? e.g Stocks, Gold or even Bitcoin?
Why a USD Bounce Could Trigger a Stock PullbackThe US Dollar has faced brutal selling during the first half of 2025. Some are even questioning whether the Dollar’s global hegemony is at risk. Early in the year the US stock market AMEX:SPY sold off aggressively, falling 19% from mid‑March to early April. Since then stocks have more than regained their losses and the Dollar is still in the tank. So where does that leave us for the rest of the year?
The Dollar Inverse Correlation
The US Dollar has an inverse correlation to most everything. Stocks, bonds, crypto, commodities, real estate — all are measured in Dollars. Therefore when the Dollar loses value, all things equal it takes more of them to reach the same value those assets were denominated at before. Conversely when the Dollar rises, other assets lose value in Dollar terms. Here we can see a long standing inverse correlation to stocks AMEX:SPY
Dollar in oversold territory
The Relative Strength Index (RSI) is a momentum oscillator that measures the magnitude of recent price changes on a scale from 0 to 100 to help identify overbought (above 70) or oversold (below 30) conditions. The Dollar has hit oversold several times so far this year, but not yet staged a material recovery.
Stocks in overbought territory
Meanwhile stocks have staged a blistering rebound off the "Liberation Day" driven selloff earlier this year. The S&P 500 now sits at an all‑time high, and you guessed it, has tapped overbought twice this month.
USD is fundamentally attractive
Because investors seek to earn the highest available yield on their capital, they tend to move funds into currencies offering higher interest rates (and away from those with lower rates), so differences in policy rates across countries create incentives for cross‑border borrowing and lending that drive FX flows. For example the Fed ( ECONOMICS:USINTR ) is at 4.5%, and the ECB ( ECONOMICS:EUINTR ) is at 2.15%. Moreover the Dollar is down significantly against major trading pairs that have lower yields. In our prior example the Dollar is down 11.98% against the Euro YTD (1- FX:EURUSD ), leaving substantial room for capital gains. Gravity could lure FX traders back in the second half of 2025.
Tariff calculus
Tariffs tend to bolster the imposing country’s currency in two main ways: by making imports more expensive they reduce import volumes, improving the trade balance (i.e. fewer foreign‑currency outflows), and by collecting duties in domestic currency the government effectively withdraws that currency from circulation, increasing its relative scarcity. Both effects lift demand for—and support the value of—the home currency.
Putting it all together
Despite the TVC:DXY ’s ~10.8% YTD slide and repeated oversold conditions, the compelling carry trade sets the stage for a USD bounce that, in turn, could pressure overextended equities. With stocks stretched and the Dollar oversold, the carry‑driven rebound in USD could well presage a pullback in equities. Stocks are expensive, Dollars are cheap 🤑

US dollar index (DXY) still looks weakAfter finding resistance near my 50-day EMA on the daily chart, TVC:DXY is now showing signs of continued weakness. Let's dig in.
MARKETSCOM:DOLLARINDEX
Let us know what you think in the comments below.
Thank you.
75.2% of retail investor accounts lose money when trading CFDs with this provider. You should consider whether you understand how CFDs work and whether you can afford to take the high risk of losing your money. Past performance is not necessarily indicative of future results. The value of investments may fall as well as rise and the investor may not get back the amount initially invested. This content is not intended for nor applicable to residents of the UK. Cryptocurrency CFDs and spread bets are restricted in the UK for all retail clients.

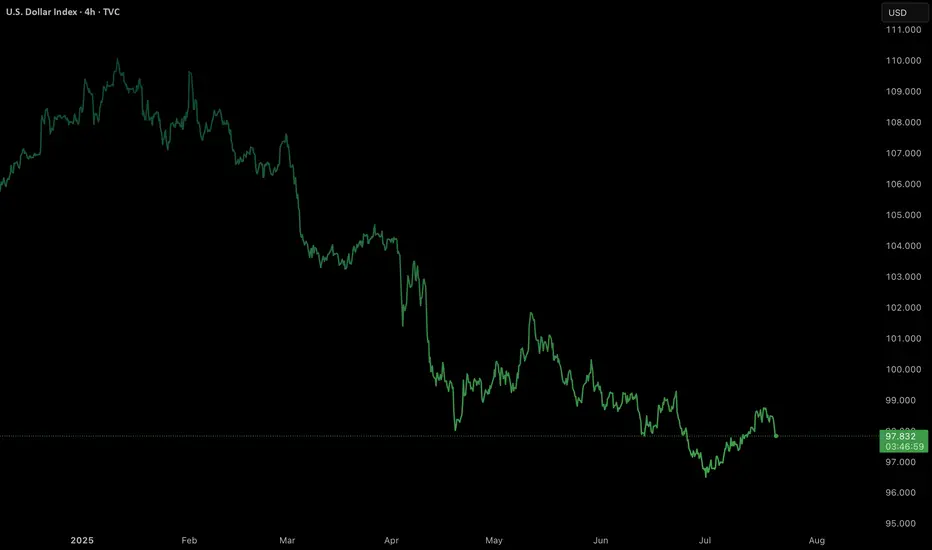
US Dollar Breakdown – Don’t Fight the FloodSince the start of the year, after forming a small double top around the 110 zone, the US Dollar Index (DXY) has followed only one direction: down.
So far, we’re seeing a decline that’s approaching 15%, with the index breaking multiple major support levels along the way. And judging by the current structure, there’s little reason to believe this trend will reverse any time soon.
________________________________________
🔍 Short-Term View – Flag Break, More Losses Ahead
Zooming in, we can observe that the last rally was purely corrective — a typical bear flag formation. That flag is now broken to the downside, which confirms renewed bearish pressure and suggests that further losses are likely even in the short term.
________________________________________
🎯 What’s Next?
The next major support zone sits around 95, a level that should act as a magnet if the current trend continues.
As long as price stays under 100 ZONE, the outlook remains bearish and the strategy should align with that bias.
________________________________________
✅ Strategy Going Forward
The safe and logical approach now is to buy dips on major USD pairs:
EURUSD, GBPUSD, AUDUSD, and NZDUSD
________________________________________
📌 Final Thought
The structure is clear, momentum favors the downside, and the market is offering clean setups across multiple USD pairs.
Don’t fight the trend — follow the flow. 🟢


Bullish reversal?US Dollar Index (DXY) is falling towards the pivot and could bounce to the 1st resistance, which is an overlap resistance.
Pivot: 96.99
1st Support: 96.38
1st Resistance: 97.90
Risk Warning:
Trading Forex and CFDs carries a high level of risk to your capital and you should only trade with money you can afford to lose. Trading Forex and CFDs may not be suitable for all investors, so please ensure that you fully understand the risks involved and seek independent advice if necessary.
Disclaimer:
The above opinions given constitute general market commentary, and do not constitute the opinion or advice of IC Markets or any form of personal or investment advice.
Any opinions, news, research, analyses, prices, other information, or links to third-party sites contained on this website are provided on an "as-is" basis, are intended only to be informative, is not an advice nor a recommendation, nor research, or a record of our trading prices, or an offer of, or solicitation for a transaction in any financial instrument and thus should not be treated as such. The information provided does not involve any specific investment objectives, financial situation and needs of any specific person who may receive it. Please be aware, that past performance is not a reliable indicator of future performance and/or results. Past Performance or Forward-looking scenarios based upon the reasonable beliefs of the third-party provider are not a guarantee of future performance. Actual results may differ materially from those anticipated in forward-looking or past performance statements. IC Markets makes no representation or warranty and assumes no liability as to the accuracy or completeness of the information provided, nor any loss arising from any investment based on a recommendation, forecast or any information supplied by any third-party.

Dollar Index (DXY): Time to Recover
It looks like Dollar Index is going to recover after a yesterday's
rapid fall.
The market reached a key support and formed a cup & handle pattern on that.
We can expect a pullback at least to 98.09 level.
❤️Please, support my work with like, thank you!❤️

Bullish bounce?US Dollar Index (DXY) is falling towards the pivot which aligns with the 78.6% Fibonacci retracement and could bounce to the 1st resistance.
Pivot: 97.00
1st Support: 96.48
1st Resistance: 97.77
Risk Warning:
Trading Forex and CFDs carries a high level of risk to your capital and you should only trade with money you can afford to lose. Trading Forex and CFDs may not be suitable for all investors, so please ensure that you fully understand the risks involved and seek independent advice if necessary.
Disclaimer:
The above opinions given constitute general market commentary, and do not constitute the opinion or advice of IC Markets or any form of personal or investment advice.
Any opinions, news, research, analyses, prices, other information, or links to third-party sites contained on this website are provided on an "as-is" basis, are intended only to be informative, is not an advice nor a recommendation, nor research, or a record of our trading prices, or an offer of, or solicitation for a transaction in any financial instrument and thus should not be treated as such. The information provided does not involve any specific investment objectives, financial situation and needs of any specific person who may receive it. Please be aware, that past performance is not a reliable indicator of future performance and/or results. Past Performance or Forward-looking scenarios based upon the reasonable beliefs of the third-party provider are not a guarantee of future performance. Actual results may differ materially from those anticipated in forward-looking or past performance statements. IC Markets makes no representation or warranty and assumes no liability as to the accuracy or completeness of the information provided, nor any loss arising from any investment based on a recommendation, forecast or any information supplied by any third-party.

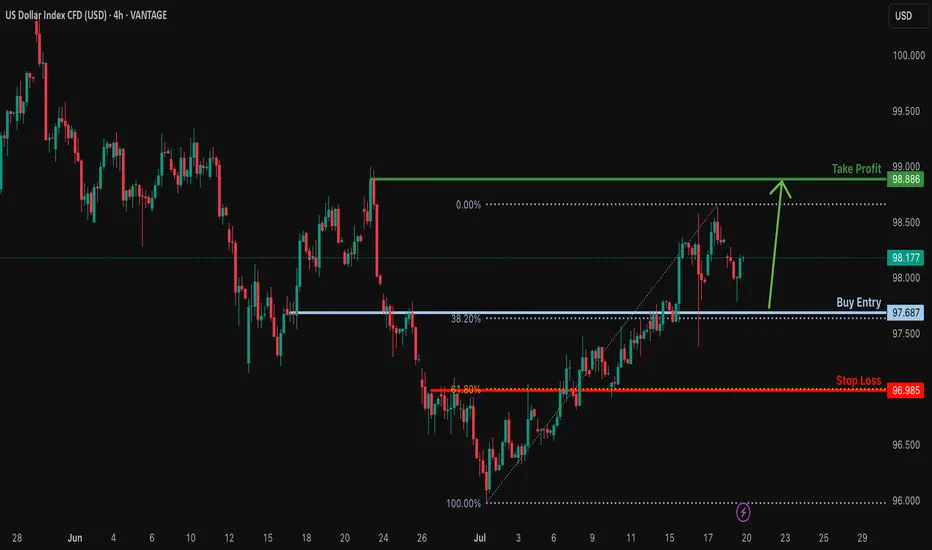
Bullish continuation for the Dollar?The price is falling towards the support level which is a pullback support that lines up with the 38.2% Fibonacci retracement and could bounce from this level to our take profit.
Entry: 97.68
Why we like it:
There is a pullback support that aligns with the 38.6% Fibonacci retracement.
Stop loss: 96.98
Why we lik eit:
There is an overlap support that aligns with the 61.8% Fibonacci retracement.
Take profit: 98.88
Why we like it:
There is a pullback resistance.
Enjoying your TradingView experience? Review us!
Please be advised that the information presented on TradingView is provided to Vantage (‘Vantage Global Limited’, ‘we’) by a third-party provider (‘Everest Fortune Group’). Please be reminded that you are solely responsible for the trading decisions on your account. There is a very high degree of risk involved in trading. Any information and/or content is intended entirely for research, educational and informational purposes only and does not constitute investment or consultation advice or investment strategy. The information is not tailored to the investment needs of any specific person and therefore does not involve a consideration of any of the investment objectives, financial situation or needs of any viewer that may receive it. Kindly also note that past performance is not a reliable indicator of future results. Actual results may differ materially from those anticipated in forward-looking or past performance statements. We assume no liability as to the accuracy or completeness of any of the information and/or content provided herein and the Company cannot be held responsible for any omission, mistake nor for any loss or damage including without limitation to any loss of profit which may arise from reliance on any information supplied by Everest Fortune Group.
Dollar Reversal? Inverse Head & Shoulders Spotted!Is the Dollar Index bottoming out? I break down a potential Inverse Head and Shoulders pattern forming on the DXY chart — a classic reversal setup that could signal a major trend change. See as I analyze the key neckline breakout zone, potential upside targets and golden zone fib support defended confirming the pattern.
I hope you find this informative. Thank you for the boosts, comments and discussions of the idea. Cheers and best wishes on every trade
# USDCHF, #AUDUSD, #USDJPY, #EURUSD, #GBPUSD Forex pairs

DXYTHE DOLLAR INDEX .
key data report ,22nd the fed chairman Powell speaks and on 24th we are expecting Unemployment Claims.
watch this data as they will shape the trade directional bias.
Key Factors Behind Today's Drop
1. Rising Global Risk Appetite and Strong Foreign Currencies
Investors are showing increased appetite for non-dollar assets today. The euro, yen, and pound have all strengthened—most notably, the dollar fell nearly 1% against the yen after political developments in Japan and a positive outlook in Europe.
European optimism was boosted by encouraging business survey results, while political clarity in Japan lifted the yen and added further selling pressure on the dollar.
2. Lower U.S. Treasury Yields
Softening U.S. yields contributed to the dollar’s weakness. Lower yields typically make the dollar less attractive relative to other currencies, further encouraging outflows.
Investors are reassessing Federal Reserve rate cut odds and show caution ahead of the July 31 Fed meeting.
3.Uncertainty Over Tariffs and U.S. Policy
Heightened anxiety around upcoming U.S. tariffs (with an August 1 deadline) and erratic policy signals are dampening confidence in the dollar as a safe haven.
Speculation over Fed independence, including market chatter about potential challenges to Chair Powell’s role, has hurt trust in U.S. monetary policy stability, fueling additional dollar selling.
Conclusion
The dollar index’s drop from its ascending trend line today is the result of a perfect storm of increased foreign currency strength, risk-seeking investor sentiment, declining U.S. yields, persistent policy and tariff uncertainty, All of these factors have combined to drive sellers selling momentum ,they will continue to push the index to its lowest levels and my structure is giving me 94-94.5 level.
trading is 100% probailty,trade with caution.

DXY: USD Flexes Muscle - Pairs SlideFriday, July 25, 2025
The foreign exchange markets are experiencing a pronounced USD bullish session this morning, with the US Dollar Index (DXY) showing robust gains of +0.35% while simultaneously pressuring all major currency pairs into negative territory. The Japanese Yen (JPY) is bearing the brunt of this dollar strength, currently registering losses between -0.4% to -0.66% across JPY pairs. This market behavior suggests traders should pay particularly close attention to DXY dynamics, as its movements will likely dictate price action across all major currency pairs in today's session.
Technical Perspective: DXY at Critical Inflection Point
A detailed examination of the Dollar Index reveals several compelling technical factors that market participants should consider:
1. Weekly Demand Zone Reaction
- The DXY has demonstrated a strong rejection from a significant weekly demand area
- The subsequent bullish spike indicates potential continuation of upward momentum
- This price action suggests institutional buyers are defending this key level
2. Commitment of Traders (COT) Report Insights
Non-commercial traders (typically hedge funds and speculators) have increased their positions from a bottom level not seen since June 2021 meanwhile the Commercial traders (often corporations hedging FX exposure) show opposing extreme positioning. This stark divergence between trader categories often precedes significant market moves
3. Seasonal Patterns Favor USD Strength
- Historical seasonal analysis indicates the current period typically supports dollar appreciation
- The combination of technical and seasonal factors creates a potentially powerful bullish setup
✅ Please share your thoughts about DXY in the comments section below and HIT LIKE if you appreciate my analysis. Don't forget to FOLLOW ME; you will help us a lot with this small contribution.

U.S. Dollar (DXY) bearish?Will dollar continue its bearish momentum or will it reverse?
Technical Summary
DXY remains in a firm bearish trend, having dropped around 11% this year. The setup is formed by a chain of lower highs and lower lows, confirming an unrelenting downtrend.
Support Level: ~97.70
Resistance Zone: 98.55–98.80
Long-Term Outlook: Bearish, unless a clear break and close over the resistance zone on the daily or weekly timeframe.
Technically, the momentum indicators remain weak, and the failure to sustain rallies above the 99.00 level also contributes to downward pressure further. The market is now consolidating within a narrow range after steep selling, which suggests probable continuation if macro catalysts are favourable.
Fundamental and Sentiment Drivers
Several macroeconomic and geopolitical drivers are underpinning the weakening of the U.S. dollar:
Federal Reserve Uncertainty:
Speculation over the ultimate fate of Federal Reserve Chairman Jerome Powell under political pressure from the executive branch has severely undermined investor confidence in the central bank’s independence. This has been manifested in increased volatility and bearish pressure on the dollar.
Trade Policy and Tariff Risks:
Ongoing trade tensions, including the possibility of sweeping tariffs (15–20%) on Chinese and European Union goods, have created a risk premium on valuations of the U.S. dollar. Market players still fear retaliation and its effects on trade stability in the world.
Fiscal Position and Credit Ratings:
The US fiscal deficit, which is approaching 7% of GDP, and recent credit rating downgrades to its outlook, have set alarms ringing regarding the structure. These fiscal developments have eroded the popularity of the US dollar as a safe-haven asset, particularly with foreign investors.
Global Monetary Landscape:
With European Central Bank and Bank of Japan maintaining policy guidance tight, and Federal Reserve already indicating that direction for a rate cut in Q4 2025 is being eyed, the falling rate differentials still maintain pressure on the dollar.
Market Outlook: Week of July 21–25, 2025
Major Geopolitical and Economic Events:
DATE : Ongoing
EVENT : U.S.- EU & U.S. — China Trade Negotiations.
MARKET RELEVANCE : High
Resolution or escalation will directly impact USD demand.
DATE : Mid-week
EVENT : Federal Reserve Speeches (including Powell)
MARKET RELEVANCE : High
Monetary policy guidance and institutional stability.
DATE : July 24–25
EVENT : Jobless Claims, Flash PMIs, New Home Sales, Durable Goods Orders
MARKET RELEVANCE : Medium–High
Labour market data, housing data, and production activity have the potential to shift rate expectations and dollar sentiment ahead of the FOMC and PCE releases.
Strategic Implications
Outlook: DXY remains structurally bearish in the short to medium term. Additional weakness below 98.80 and sustained closes below 97.70 would reassert downward momentum, risking a further retracement to the 96.00-95.50 region.
Possible Bullish Reversal Triggers:
A conclusive resolution to U.S. trade negotiations.
Unexpectedly solid economic data (particularly core inflation or employment).
Hawkish Fed commentary supporting policy tightening expectations.
Last thoughts
The U.S. Dollar Index is currently at structurally weak technical and fundamental foundations. Absent a sudden reversal of the monetary policy message or geopolitical resolution, the path of least resistance appears to remain to the lower side. Market participants need to pay special attention to upcoming economic data releases, central bank rhetoric, and trading news because any one of them could be a pivotal driver of near-term dollar behavior.
DOLLAR INDEX TO COMPLETE WAVE 5 TARGET at 98.866In this short video I dive into the technical breakdown of the U.S. Dollar Index (DXY) as it approaches the anticipated Wave 5 surge, aiming for the key resistance level of 98.866. Using Elliott Wave Theory, this analysis maps out the market’s current structure on the 4 hours timeframe, highlights critical pivot zones, and projects the bullish momentum that could reshape short-term outlooks. Whether you're a seasoned trader or a curious observer, this chart-driven insight offers clarity in the wave progression and what might come next.
