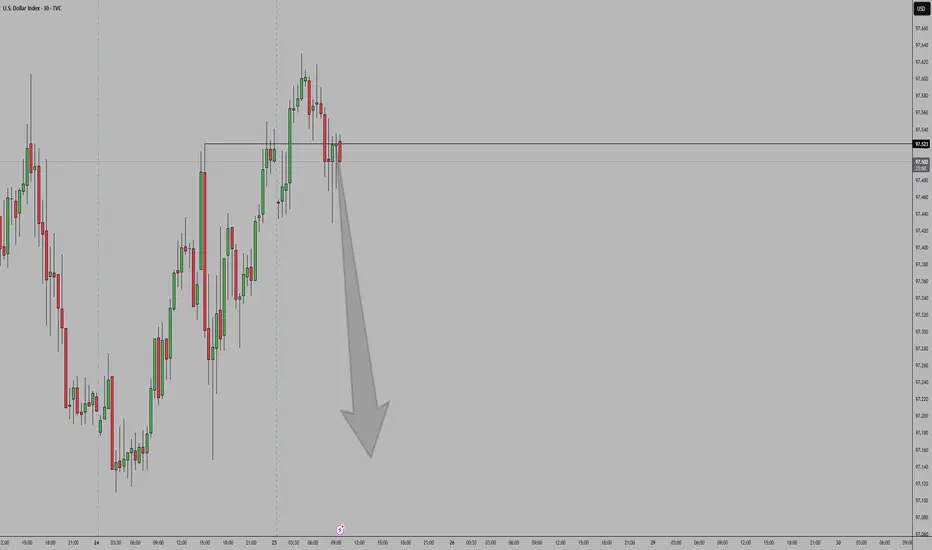
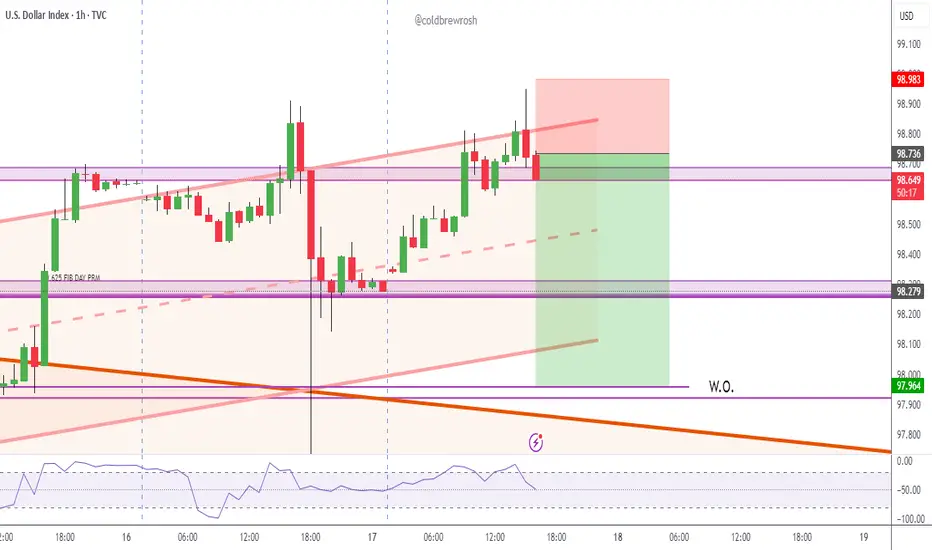
DXY Outlook – From Bias to Execution Previous day closed bearish from a known supply leading to a sell bias, On the 45M, I am currently looking out for possible entry or exit.
USDX trade ideas

DXY 4Hour TF - July 20th, 2025DXY 7/20/2025
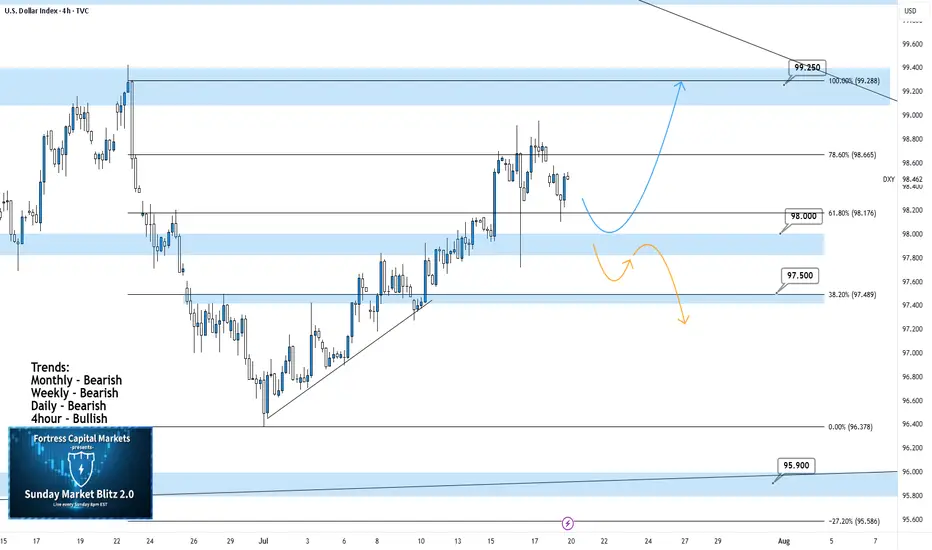
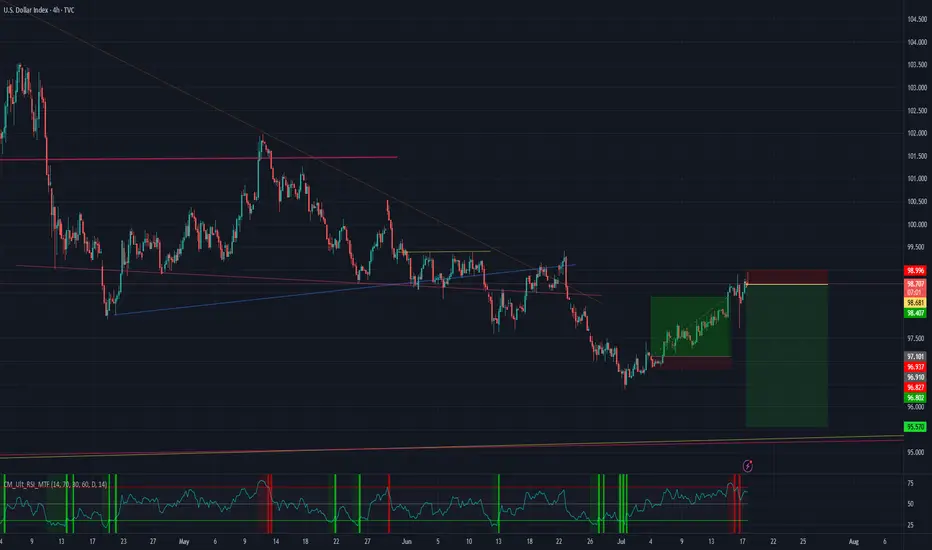
DXY 4hour Neutral Idea
Monthly - Bearish
Weekly - Bearish
Dailly - Bearish
4hour - Bullish
Higher timeframe trend analysis suggests that DXY is primarily bearish and is currently retracing to potential resistance.
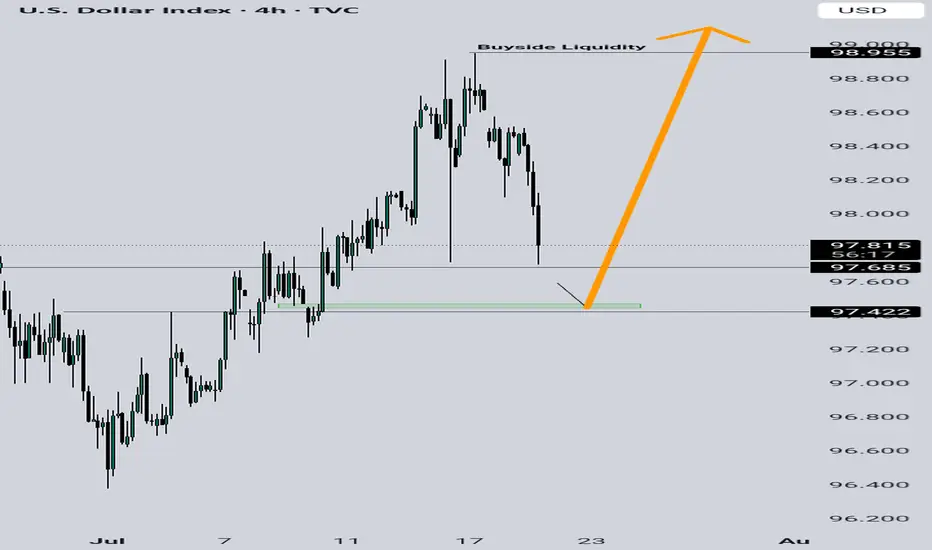
Going into this week we are looking to see if our 98.000 zone will stay as support or transition into resistance. Here are two scenarios which highlight both a bullish and bearish outcome:
Bullish Continuation - Last week we saw a strong rally through our 98.000 zone which seems to still be holding. If this 4hour bullish trend is to continue we would like to see some sort of rejection off 98.000 support while also confirming a higher low. If this happens look to target higher toward major resistance levels like 99.250.
Bearish Reversal- If we are to consider DXY bearish again on the 4hour we would need to see a break below 98.000 support and confirm this level as new resistance.
There are a few major support levels to watch out for but DXY has the potential to fall dramatically if we see price get below 97.500.
DXYThe U.S. Dollar Index (DXY) continues to exhibit a bearish outlook driven by a combination of technical weakness and shifting macroeconomic fundamentals. Market expectations for Federal Reserve rate cuts, coupled with softer U.S. economic data and declining demand for the dollar as a safe-haven asset, have weighed heavily on the index. Technically, the DXY remains below key moving averages, with momentum indicators showing sustained weakness. Unless there is a significant shift in sentiment or a surprise in monetary policy direction, the bias remains to the downside over the near to medium term.
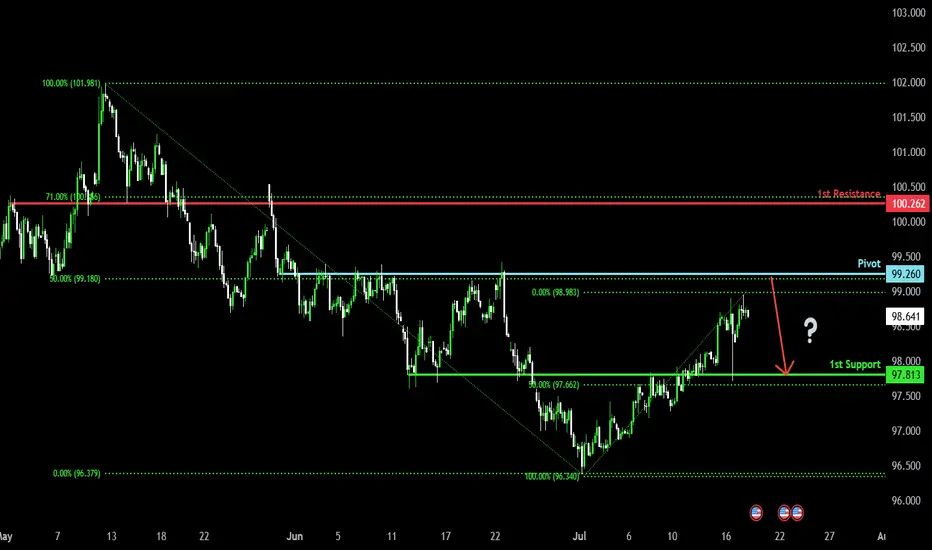
Bearish reversal?US Dollar Index (DXY) is rising towards the pivot and could reverse to the 1st support which acts as an overlap support.
Pivot: 99.26
1st Support: 97.81
1st Resistance: 100.26
Risk Warning:
Trading Forex and CFDs carries a high level of risk to your capital and you should only trade with money you can afford to lose. Trading Forex and CFDs may not be suitable for all investors, so please ensure that you fully understand the risks involved and seek independent advice if necessary.
Disclaimer:
The above opinions given constitute general market commentary, and do not constitute the opinion or advice of IC Markets or any form of personal or investment advice.
Any opinions, news, research, analyses, prices, other information, or links to third-party sites contained on this website are provided on an "as-is" basis, are intended only to be informative, is not an advice nor a recommendation, nor research, or a record of our trading prices, or an offer of, or solicitation for a transaction in any financial instrument and thus should not be treated as such. The information provided does not involve any specific investment objectives, financial situation and needs of any specific person who may receive it. Please be aware, that past performance is not a reliable indicator of future performance and/or results. Past Performance or Forward-looking scenarios based upon the reasonable beliefs of the third-party provider are not a guarantee of future performance. Actual results may differ materially from those anticipated in forward-looking or past performance statements. IC Markets makes no representation or warranty and assumes no liability as to the accuracy or completeness of the information provided, nor any loss arising from any investment based on a recommendation, forecast or any information supplied by any third-party.
FX Matrix: DXY, EUR/USD, GBP/USD Weekly AnalysisWeekly Targets: (Gun to my head)
DXY: 99.957, 100.424, 100.689
GBPUSD: 1.31643, 1.31453,

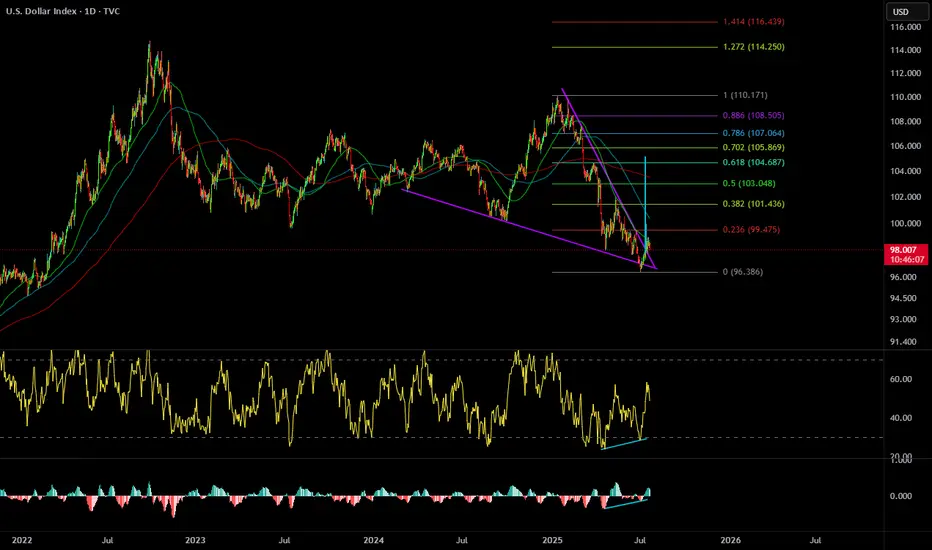
DXY BULLISHWe sitting on a trendline third touch and also in confluence with a 61.8% level once we hold we should see a takeoff or highest we dump into $94 then we takeoff

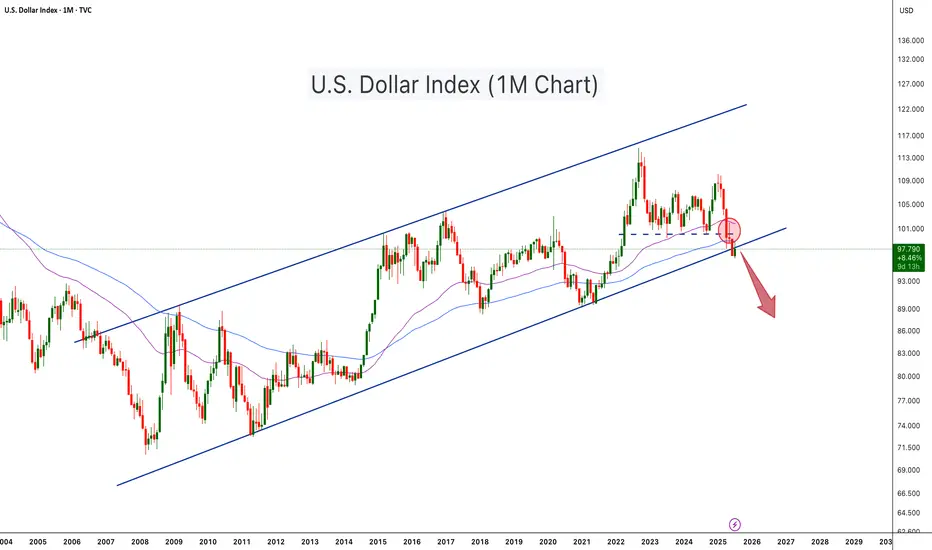
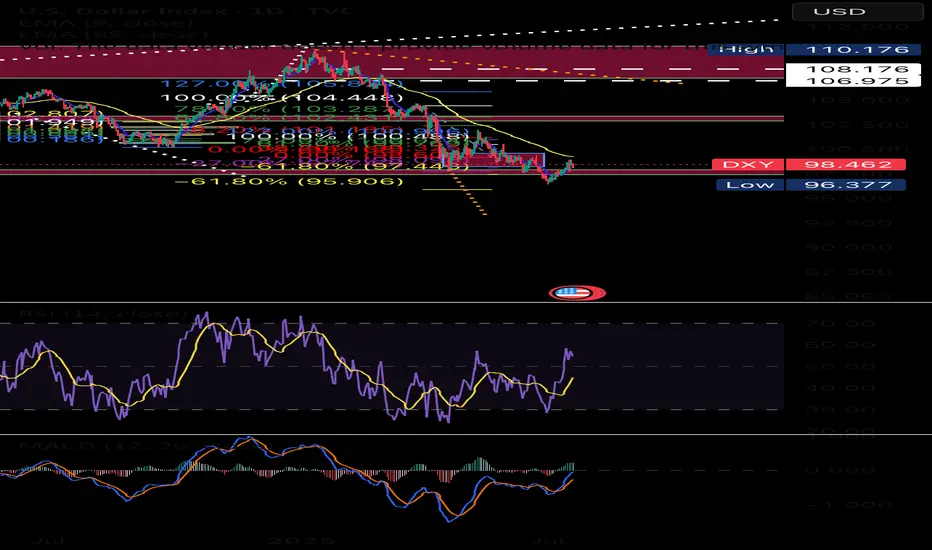
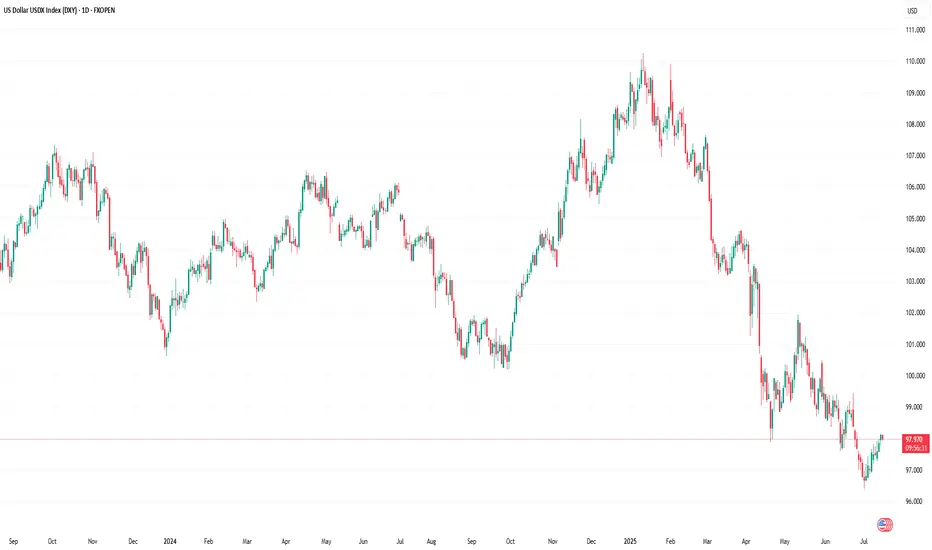
U.S. Dollar Index Loses Key Support – Crypto Bull Run Loading?The U.S. Dollar Index (DXY) has just broken below a long-term ascending channel, which has held since 2008. After losing the key horizontal support (~100 level), DXY retested and rejected from it (red circle), confirming a potential trend reversal. The move is technically significant and hints at further downside, possibly toward the 88–90 zone or lower.
This breakdown aligns with classic macro cycles, where a weaker dollar often fuels bullish momentum in risk assets, especially crypto. Historically:
-DXY downtrends in 2017 and 2020–2021 coincided with major Bitcoin and altcoin bull runs.
-DXY strength during 2018 and 2022 contributed to crypto bear markets.
With DXY now below both horizontal and diagonal support, Bitcoin and the broader crypto market may be entering the next expansion phase, especially if the dollar continues its downward trajectory
-DXY has broken below a 17 year rising channel – a macro bearish signal.
-Rejection from former support turned resistance confirms breakdown.
-A falling DXY historically corresponds with Bitcoin rallies and altseason expansions.
-Declining dollar strength could be the fuel that propels Bitcoin past $140K and Ethereum above $6K.
-A dollar bear trend may fuel total crypto market cap breakout beyond $4T+.
As DXY weakens, liquidity tends to rotate into risk-on assets like crypto. This setup mirrors pre-bull run environments seen in 2017 and 2020. A structural breakdown in the dollar could act as a catalyst for Bitcoin’s next major leg up.
Cheers
Hexa
DXY to establish weekly low then a run higher I'd like to see a weekly low form at the outlined level and find support then rally higher
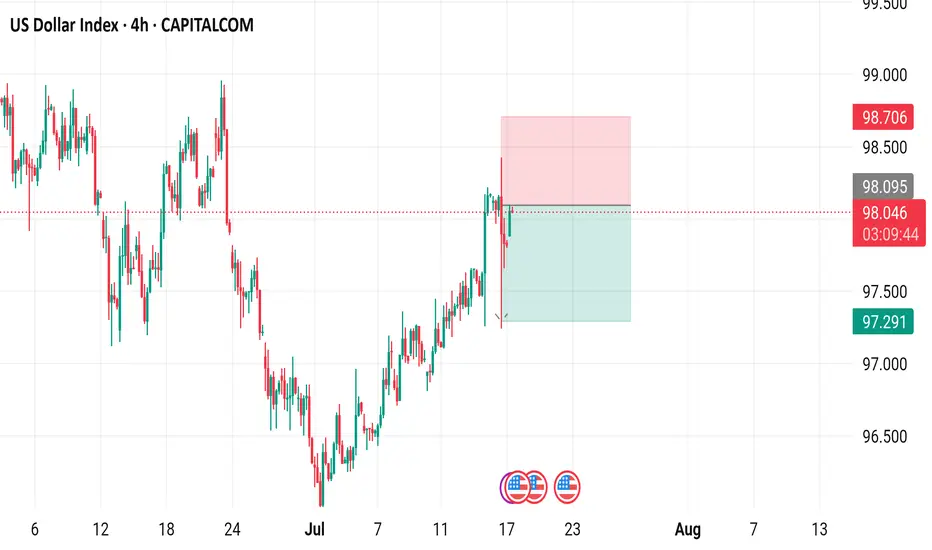
US Dollar Index (DXY) - 4 Hour Chart4-hour performance of the US Dollar Index (DXY) from CAPITALCOM, showing a current value of 98.040 with a 0.23% increase (+0.222). The chart includes recent buy and sell signals at 98.094 and 98.040, respectively, with a highlighted resistance zone around 98.706-99.000 and a support zone around 97.291-98.040. The timeframe covers data from early July to mid-August 2025.
what ifdxy view i just want to leave there for my lulz and see what happens in a couple years so i can lol at myself yet again

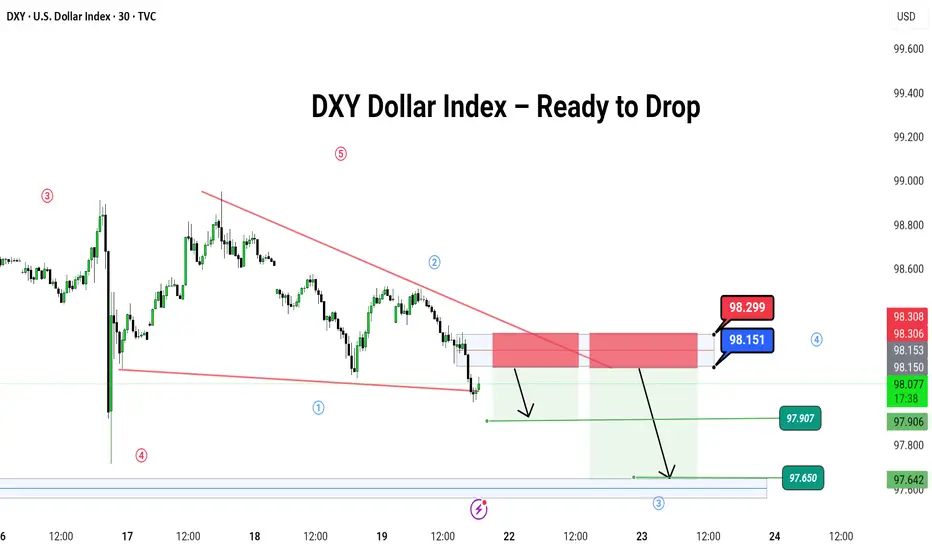
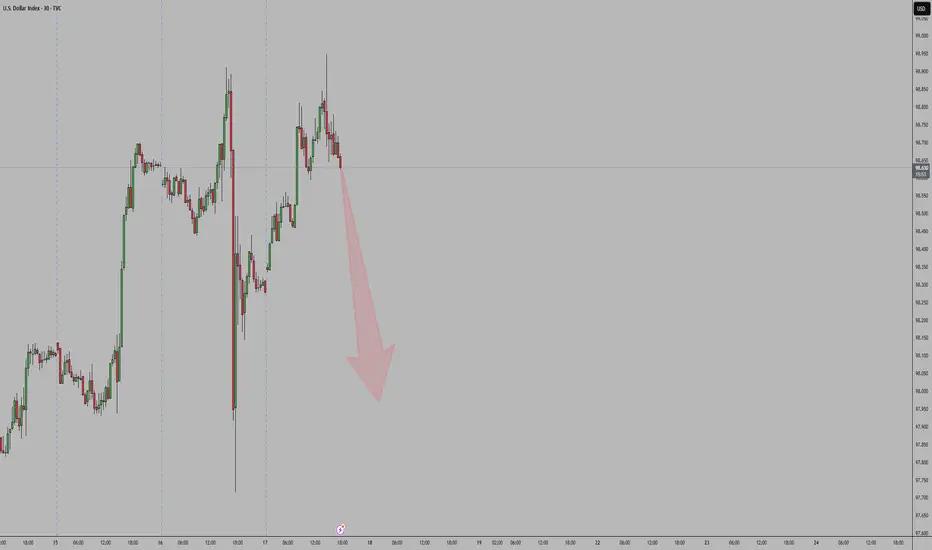
DXY Dollar Index – Ready to Drop
🌪️ DXY Dollar Index – Ready to Drop Like a Hot Potato? 💸
Hey traders! 🎯
The DXY (U.S. Dollar Index) is dancing inside a falling wedge 🔻, and it just hit the top of the party zone (red box 🎁).
📍 We're watching for a bounce up to this red zone near 98.151–98.299, then expecting a big slide down like a rollercoaster 🎢 toward:
🎯 Target 1: 97.907
🎯 Target 2: 97.650
🛑 Stop if it jumps over: 98.299
🌀 Pattern: Ending Diagonal / Wave 5 Setup
🧠 Logic: Smart money might be setting up the final wave before a major fall. Let it pop, then drop!
💡 It’s like the last spark before the fireworks go out 🎆
---
#DXY #USDIndex #ForexTrading #Wave5 #PriceAction #ChartPattern #SimpleTrading #DollarDrop
---
Let me know if you have ant suggestion ,
DXY 1D – Tipping Point: News or Price Action?Hey Guys,
The DXY index is currently moving within a downtrend. This trend is unlikely to reverse unless it breaks above the 98.950 level.
Sure, key fundamental data could shift the trend, but without those news catalysts, a reversal at this point doesn’t seem realistic.
Don’t forget—98.950 is a critical threshold for the DXY.
I meticulously prepare these analyses for you, and I sincerely appreciate your support through likes. Every like from you is my biggest motivation to continue sharing my analyses.
I’m truly grateful for each of you—love to all my followers💙💙💙

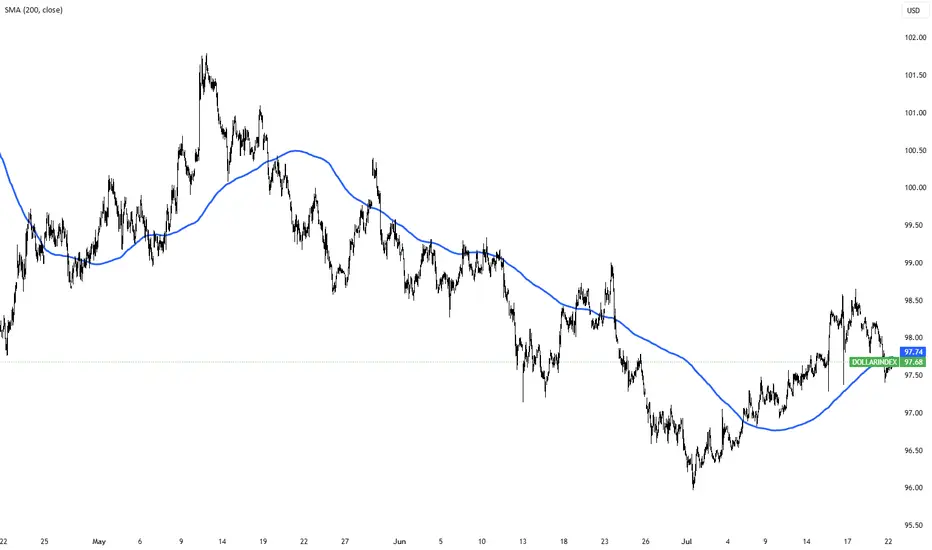
Dollar $DXY Bullish WedgePretty clean falling wedge with divergence. Aligns with a pullback to come on BTC and Stocks.
A move back to 104 area would do some damage to risk on assets.
Follow for updates.
Dollar Index Holds Below 98 as Markets Await Trade Deal ProgressThe dollar index remained below 98 today, extending its two-day decline as investors watched trade negotiations ahead of the August 1 deadline. Treasury Secretary Scott Bessent said deal quality is the priority, suggesting Trump could grant extensions to countries showing real progress.
Markets are also focused on Fed Chair Powell’s speech for signals on interest rates. Despite Trump’s push for a cut, traders are not expecting action this month.
$DXY🧠 What if the U.S. is intentionally slowing down the economy to weaken the dollar…
Letting the Chinese yuan strengthen so China is forced to shift from exports to consumption?
A stronger yuan means China imports more.
That’s a win for U.S. companies ready to sell.
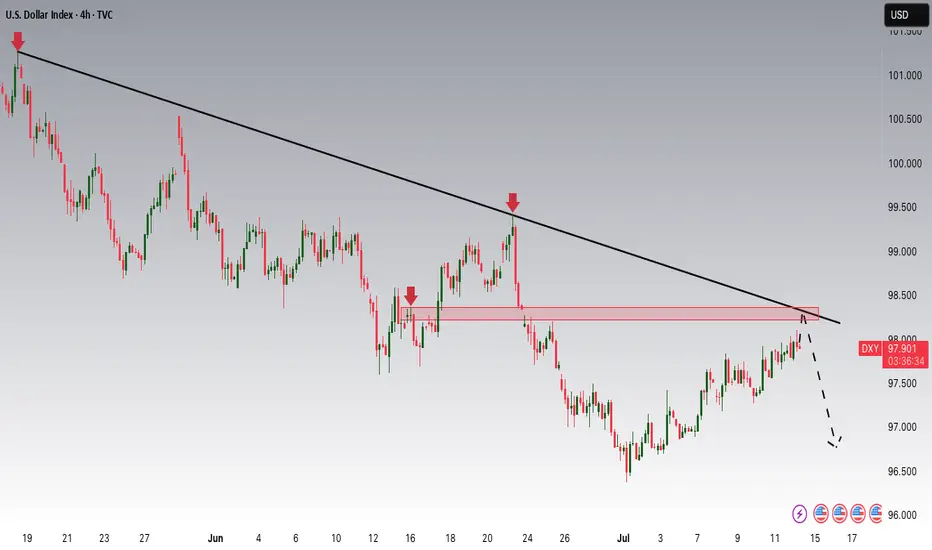
DXY area to watch.Approaching the extreme of the recent bearish leg. If it holds, then expect most major pairs (EURUSD, GBPUSD etc) to continue their upside momentum. If it fails, then we can expect to see further downside moves on the majors.
As per my strategy. That extreme POI swept a previous high, created the BOS, and sits beautifully on the 71% retracement level. The majority of my confluences are ticked, just missing that clear 'Imbalance'. So now we wait, and monitor the reaction on the 4H. If we see a nice clean liquidity sweep, BOS + Imbalance then I'm in for sells.
Let me know your thoughts, anything can happen!

DXYShort-Term Bearish DXY – Key Reasons
1. Rate Cut Expectations
Markets are pricing in at least one Fed rate cut in Q3 2025 due to slowing inflation and weaker consumer data.
Lower interest rates reduce demand for the dollar, pushing DXY lower.
DXY BEARISH PROBABILITYThe DXY has shown a strong bearish probability after attaining the weekly premium as guided by the ICT model and BTMM.I suppose the move will be sustained as indicated else we stop at the determined level
Dollar Index Macro analysisCurrently the Fed's Dollar is kept at 5.50% which is higher than any other currency except for the Kiwi , As we all know interest have high impact on currency prices. We are currently in a consolidation market profile. Therefore my interest is where the next expansion will be at, Clearly defined on my analysis it should be on the upside.

A Closer Look at the Role and Recent Volatility of the (DXY)A Closer Look at the Role and Recent Volatility of the US Dollar Index (DXY)
We don’t even need to say that the US Dollar Index (DXY) is one of the most influential benchmarks in global currency markets. The index, which measures the value of the US dollar against a basket of six major currencies, experiences heightened volatility and presents potential opportunities.
Understanding the DXY: A Macro Lens on the Dollar
The DXY tracks the relative strength of the US dollar versus a weighted currency basket including the euro, Japanese yen, British pound, Canadian dollar, Swedish krona, and Swiss franc. Although the euro comprises nearly 58% of the index, the DXY reflects broad USD strength or weakness across global markets, not just against a single currency.
Traders and analysts use the DXY as a key macro indicator—to track policy divergence between central banks, to hedge USD exposure, and to assess broader market sentiment. Rising DXY levels often signal tightening US policy or global risk aversion, while declines may reflect weakening growth expectations, dovish Fed policy, or geopolitical stress. In volatile environments like 2025, the DXY serves as a real-time barometer of global confidence in the US economy and dollar-based assets.
Recent Price Swings: Tariffs & Policy Uncertainty Shake the Dollar
Since April, the US Dollar Index has faced one of its most volatile stretches in years, driven by a convergence of Federal Reserve policy uncertainty and new trade tariffs announced by President Trump.
April: “Liberation Day” Tariffs Trigger Market Shock
On 2 April, the announcement of sweeping “Liberation Day” tariffs—10% on nearly all imports, with higher duties on selected countries—jolted currency markets. The DXY fell over 2% in a single day. In the following weeks, the index continued to decline as business confidence deteriorated and early signs of recession risk emerged.
May–June: Policy Headwinds Compound Dollar Weakness
As the tariff package took effect, the dollar extended its slide—marking a ~10% drop from its late‑2024 peak, the worst first-half performance in over 50 years. Investors reassessed US growth prospects amid the pressures of trade friction. The Fed responded with a hawkish pause, while President Trump publicly urged for rate cuts, further muddying the policy outlook and pressuring the dollar.
July: Uncertainty Builds
By early July, the DXY had fallen below 97, tallying an approximate 11% year-to-date decline. Analysts cite a “perfect storm” of expanding fiscal deficits, erratic trade decisions, and growing doubts over US policy credibility as key reasons for the dollar’s fall from favour.
Why DXY Matters Now More Than Ever
The DXY has become a real-time gauge of market confidence in US policy stability. The dollar’s sharp decline in 2025 underscores how fragile that confidence can be in the face of aggressive trade measures and uncertain monetary direction.
The introduction of Trump’s tariffs has raised structural concerns among investors:
- Growth expectations have been cut due to higher input costs and supply chain friction.
- The so-called safe-haven appeal of the USD has eroded, with flows shifting to the euro, Swiss franc, and gold.
- Foreign demand for dollar assets has softened, as fears of a prolonged trade conflict and fiscal indiscipline mount.
In this climate, the DXY has evolved into a barometer for geopolitical tension, inflation fears, and investor sentiment towards US leadership.
Bottom Line
The DXY is not just a tool for dollar specialists—it's a key reference for any trader dealing with macro-sensitive instruments. As the global rate environment continues to shift and the US economy shows mixed signals, the DXY may become one of the most revealing indicators to watch and trade in the second half of 2025.
This article represents the opinion of the Companies operating under the FXOpen brand only. It is not to be construed as an offer, solicitation, or recommendation with respect to products and services provided by the Companies operating under the FXOpen brand, nor is it to be considered financial advice.
DXY Potential DownsidesHey Traders, in today's trading session we are monitoring DXY for a selling opportunity around 98.300 zone, DXY is trading in a downtrend and currently is in a correction phase in which it is approaching the trend at 98.300 support and resistance area.
Trade safe, Joe.
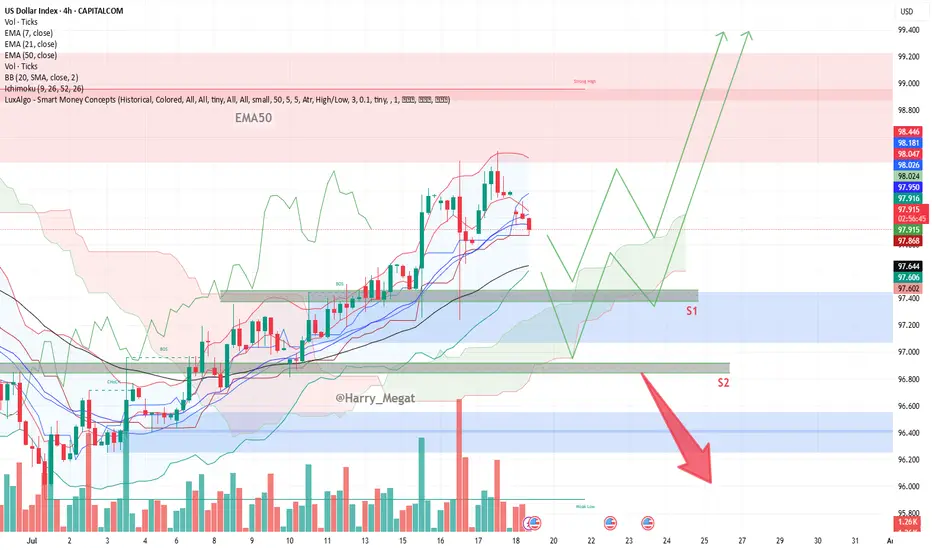
DXY Chart Outlook: Trend, Support, and Price Objectives**DXY Chart Outlook: Trend, Support, and Price Objectives (Reworded Analysis)**
**Trend Overview**
* The DXY chart reflects a **clear upward trajectory**, characterized by a sequence of **ascending highs and higher lows** — a classic sign of bullish momentum.
* Currently, the price is **retracing toward the 50-day EMA**, which appears to be holding as **dynamic support**.
* Two important **horizontal support zones** are marked:
* **Support 1 (S1):** \~97.400 (aligned with EMA-50)
* **Support 2 (S2):** \~96.800 (a deeper correction level)
**Projected Price Zones**
* **Near-Term Objective:** **98.800 to 99.000**
* A rebound from the EMA or S1 could send price higher toward this zone, continuing the current bullish structure.
* **Mid-Term Target:** **99.200 to 99.400**
* If the price successfully clears the 99.000 resistance, further bullish continuation could aim for this intermediate target range.
* **Extended Target:** **100.000+**
* A sustained breakout beyond 99.400 could open the path toward **psychological resistance at 100.000**, possibly higher on strong momentum.
**Support Zones to Watch**
* **S1 (97.400):** This level coincides with the 50-day EMA and represents a **first line of defense**.
* **S2 (96.800):** Should the price fall below S1, this secondary level could provide **stronger support** and potential bounce opportunity.
**Risk Management**
* Consider placing a **protective stop** just below S2 — around **96.500** — to safeguard against a potential trend reversal or deeper correction.
**Summary**
* The DXY remains **technically bullish**, with potential upside targets at **98.800**, **99.400**, and eventually **100.000+**.
* Traders can monitor **S1 and S2** for potential entries or trend confirmation.
* A **breakdown below 96.500** would invalidate the bullish setup and warrant caution.