The strength in the move in credit spreads is thought provokingThe strength of the move in credit spreads since the week of Jan 20th is really unusual. Even during Covid when spreads really widened in a short amount of time the "strength" of the move doesn't compare to what we are witnessing right now with this move.
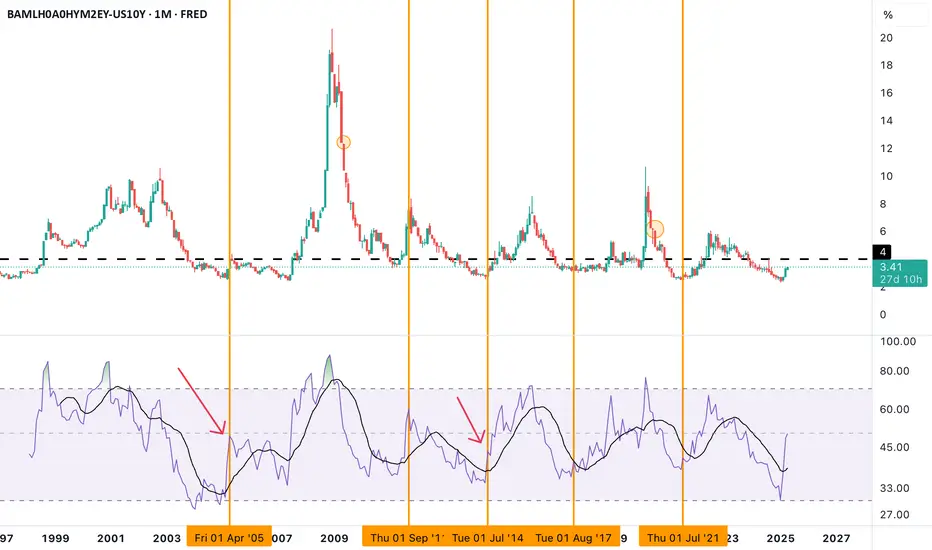
One comparable timeframe Is June 2007-July 2007. The move in the RSI in credit spreads is what STARTED the great financial crisis. After this huge move happened spreads rose for the next 73 weeks or a little under a year and a half making higher highs and higher lows.
Another comparable timeframe is May 2002-July 2002; Spreads had already been making higher highs and higher lows; were already above 4; and then this move is what ENDED the dot.com bubble.
BAMLH0A0HYM2EY trade ideas
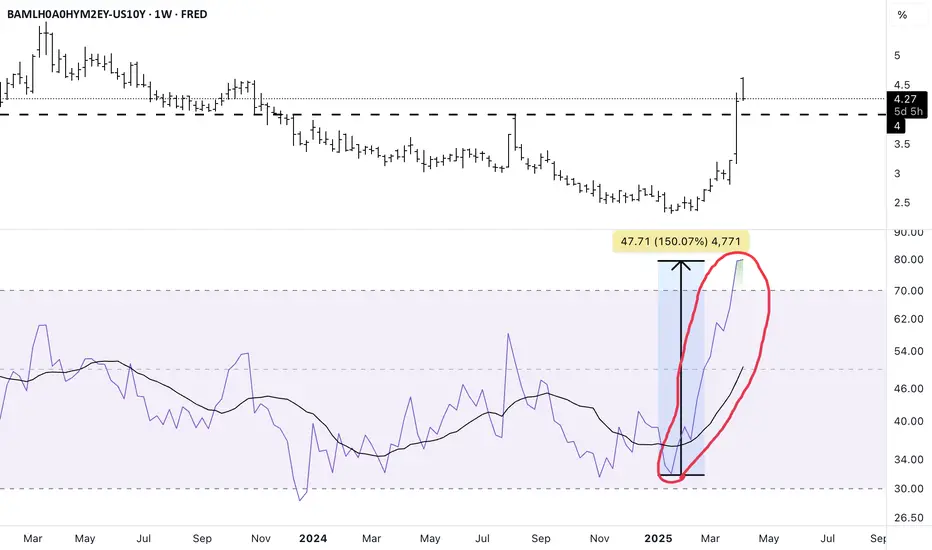
Spike in Credit Spreads continues...As I wrote on March 4th after February monthly closing...the RSI on credit spreads made a higher high with Feb closing which indicates a change from a down trend in credit spreads to an uptrend; which is not good for risk assets.
Now that March has closed; you will see yet another spike in the RSI to close at another higher high. This spike in RSI is actually rather large even though credit spreads are still less than 4.
I've seen a lot of people on X laughing at people who have mentioned that credit spreads are "spiking" because when you look at the graph of credit spreads they still below 4 and do not appear to be spiking.
Here's the thing...when spreads do spike you will be late to the party!
So what happens when spreads get to 4? Do they do what they did in 2005 or 2014? The answer to this question will dictate how the market will react in the short term.
Eventually however spreads will blow up...it's not an if but a when once RSI changes over to an uptrend.
Caution is now warranted The RSI on credit spreads is changing course from being in a downtrend to starting an uptrend. With February's monthly closing we now have a higher high. Risk assets will not be the place to hide out; especially if you are leveraged long.
Here is how the SPX has performed after changing course. The red vertical lines are the dates the RSI on credit spread changed from a downtrend to an uptrend while the green dotted vertical lines was the bottom in SPX.
As you can see it is never immediate....

Using Credit Spread chart for bull/bear market sentiment changesIt's known that credit spreads under 4 indicate a low risk on type market. (The black dotted line on the above chart indicates 4 so you can clearly see above/below)
You can then use the RSI index to gauge whether or not the market might see a "change" in sentiment. A declining RSI means bull mode while a rising RSI means bear mode (could be just a market correction OR it could lead to a major bear).
What to notice about the above chart:
1. RSI tops are usually very aggressive; V-Shaped type moves thus making market bottoms typically a little more challenging in the moment.
2. RSI bottoms usually give you a warning sign and are typically more gradual thus you can use more fundamental analysis to gauge whether or not it might just be the usual market correction or a possible major bear market (i.e. like the one between 2000-2009).
You can see using the green circles how the RSI changes course from down to up with the important caveat that credit spreads should be below 4; which indicates complacency in the marketplace IMO.
Going back in time...the chart below shows on SPX in real time when "caution" (yellow vertical line) was indicated; meaning the RSI was showing a possible double bottom to indicate a possible change in direction vs. "extreme caution" (red vertical line) was indicated; meaning the RSI created a clear higher high & higher low thereby definitely shifting RSI from down to up.
As you can see sometimes the corrections happen immediately thereafter and sometimes the market continues upward for a bit (especially after yellow vertical line signals). HOWEVER, once the RSI change in direction does indeed occur either using the yellow or red vertical lines...the SPX has always eventually traded lower once you have a trigger date. This would allow those who do not hedge to re-evaluate their portfolios for a risk off type upcoming move.
LASTLY but most importantly (Especially if you are currently really bearish on the overall US market)...look at the current RSI. We are in a downtrend (SPX bullish), we are below 4 (risk on) AND we are no where near a possible bottoming process on the RSI at the moment (the current green circle looks nothing like the past). We are certainly where one should be on high alert that a bottoming process on the RSI MIGHT begin to form however it needs to play out first and only then should you begin to start looking to short SPX.

Macro perspective on SPXFirst pane is SPX, no explanation needed here.
Second pane is ICE BofA US High Yield Index Effective Yield (Performance of US dollar denominated below investment grade rated corporate debt publicly issued in the US domestic market). Usually when it hits numbers above 9+ market is oversold and 10-week breadth/momentum indicator is awful. Now, that is not the case.
Third pane is 10-week MA of MMTH Index (Percent of Stocks Above 200-Day Average). I use it as long-term momentum indicator.
We might be just getting started our freefalling according to this. It's not so useful for timing purposes, but it lets you know where we are in a cycle. Apply other technical tools to take advantage of this data.
Feel free to share your opinions and strategies.

Corporate Credit Conditions: Part 4In part 4 we look at the all in yield of investment grade (IG) and high grade (HY) credit, and why, despite OAS spreads resting at long term median, there still may be considerable investment value in the all-in-yields of short to intermediate maturity IG notes and ETFs. Understand, this discussion does not constitute an investment recommendation, only an illustration of a portion of my corporate investment and evaluation process.
The yield of a corporate security is primarily comprised of two elements, the base rate and the credit spread. The base rate is the treasury rate (either real or extrapolated) at the matched point of the yield curve and the credit spread is the compensation for the higher default risk and the occasional periods of higher than normal volatility. The combination of the two is the all-in-yield.
In other words, when you purchase a corporate bond, you receive a base rate (the risk free treasury rate) instrument with a compensatory credit spread. In most periods, the yield premium serves to reduce the volatility of the corporate compared to the treasury. In other words, corporate returns are generally driven by changes in treasury rates. There are exceptions. In 2008 all-in-yields rose sharply (to all-time highs) even as rates fell. In this period, the widening was entirely due to widening credit spreads rather than rising rates. The sharply wider credit spread reflected fear of massive defaults (which were not realized).
Currently the ICE BofA Investment Grade Corporate Index (C0A0) all-in-yield is 6.24%. This for an index with an 8.3 year duration. This is the highest all-in-yield since June 2009 and picks up roughly 244 basis points (bps) to the duration matched point on the Treasury curve (extrapolated from the US Treasury daily par curve). When adjusted for expected default and downgrade risk, the all-in-yield is attractive, even given the growing evidence of a new downgrade cycle.
Unfortunately, the index (and LQD) has a duration over 8 years. This implies that for every 100 basis point increase in yield (whether driven by increases in yield or spread), that the investment will lose roughly 8%. Clearly, an investment in the IG index has a tremendous amount of rate risk. Assuming another 100 bps increase in Treasury rates and perhaps 100 basis points of spread widening implies a roughly 16% decline (8 year duration, x 200 bps higher in yield), consuming three full years of yield. Unless you believe that yields and spreads have peaked, there is considerable risk in the trade.
Due to the flatness of the curve, front end corporates with their much shorter durations offer much better risk reward profile. For instance, the effective yield of the 1-5 year investment grade index (CVA0) is 5.38% and the duration is only 2.65 years. In other words, only a 100 bps give in yield with only about 1/3 of the rate/spread risk. If the combination of five year rates and spreads increase 200 bps over the next year, the -5.3% implied price change would consume only one year of the investments yield. Anything less than a cumulative 200 bps would produce a positive nominal return.
High yield with its shorter duration (roughly 4 years) and at major resistance in the 9.5% range is also interesting mathematically. The beginning yield of 9.5% provides tremendous cushion against the combination of rising base rates and widening credit spreads. Extrapolated over two three and five year periods, losses and defaults would have to be extreme to create negative period returns.
Once a fundamental relative value proposition is reached, traditional technical tools can be employed to design a trade and set risk management levels. Throughout this series we have made the case that the largest driver of corporate returns is the change in treasury rate. Begin by assessing the treasury charts (in this case 2 and 5 year Treasuries). After assessing those charts, move to more specific corporate charts. Begin by looking at broad index yield and OAS charts and then drop directly to charts that more closely resemble the proposed trade in terms of duration and credit quality. There are investment grade and high yield ETFs and funds available in most ratings and maturities.
And finally, many of the topics and techniques discussed in this post are part of the CMT Associations Chartered Market Technician’s curriculum.
Good Trading:
Stewart Taylor, CMT
Chartered Market Technician
Taylor Financial Communications
Shared content and posted charts are intended to be used for informational and educational purposes only. The CMT Association does not offer, and this information shall not be understood or construed as, financial advice or investment recommendations. The information provided is not a substitute for advice from an investment professional. The CMT Association does not accept liability for any financial loss or damage our audience may incur.

