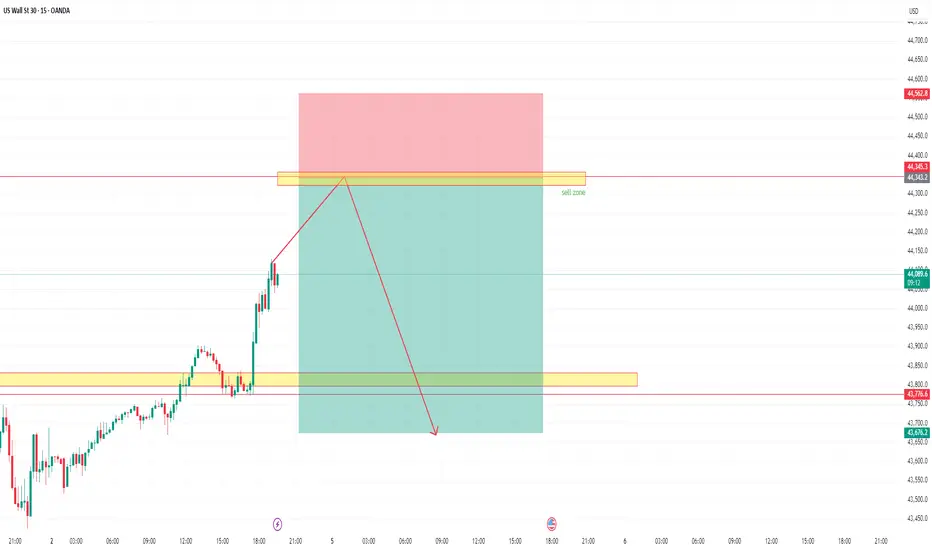
US 30 -Short -TGT 43682US30 to fall to the levels of 43682. The Index expected to hit the levels of 44343 before the fall.
DJIA trade ideas
US30 Faces Pressure Below 44610US30 Overview
Technical Outlook:
US30 is showing bearish momentum while trading below the pivot zone at 44610. As long as the price remains under this level, downside pressure may continue toward 44360, with further support at 44180.
However, a confirmed breakout above 44720 would shift the bias to bullish, opening the path toward 44910 and potentially 45100.
Support Levels: 44480 • 44360 • 44180
Resistance Levels: 44720 • 44910 • 45100
Bias: Bearish below 44610, Bullish above 44720

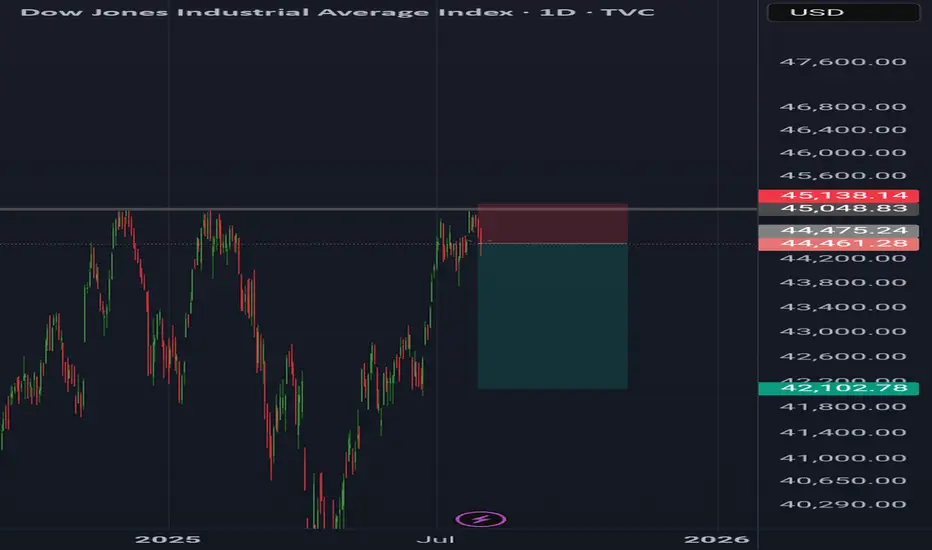
Anticipating DJIOn the daily timeframe, the current position of the Dow Jones Industrial Average (DJI) is projected to follow one of three possible scenarios:
Scenario 1 (Black Label):
DJI is currently in the process of forming Wave iv of Wave , implying that any short-term rebound is likely to be limited. The index may test the resistance area between 43,953–44,142, but remains vulnerable to further downside correction thereafter.
Scenario 2 (Red Label):
In this scenario, Wave 4 is considered complete, allowing DJI to resume its upward momentum. A breakout would signal the start of Wave 5, targeting the 45,324–46,465 range for a potential new higher high.
Scenario 3 (Blue Label):
Here, DJI is assumed to be in the midst of Wave 4 of Wave (5). A corrective move is expected first, potentially revisiting the support zone around 42,262–43,028, before continuing its bullish trend to form a new higher high.

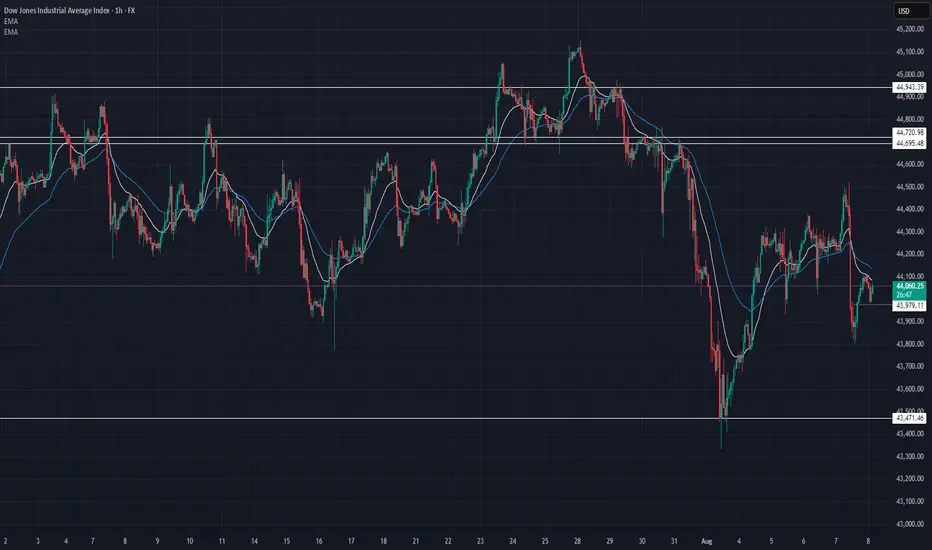
US30 Technical Breakdown – 08/08/2025📍 US30 Technical Breakdown – 08/08/2025
US30 has pulled back from the 44,360–44,400 resistance zone and is now trading around 44,060 after a failed breakout attempt. The rejection near 44,400 confirms it as a key supply zone. Price is now testing the 43,950–44,000 support band.
Short-term momentum has turned soft again, and price is stuck below the key EMAs. Bulls need to defend 43,950 to avoid a deeper rotation toward 43,600–43,470.
📊 Current Market Behavior:
📉 Rejection off lower highs
📊 Trading back below short-term EMAs
🧱 Range between 44,400 and 43,950 tightening
⚠️ Bias tilting bearish unless 44,200 is reclaimed
📌 Key Levels:
🔹 Resistance Zones:
44,200–44,360 → Breakdown zone
44,600–44,720 → Major resistance overhead
44,943 → Last key swing high
🔹 Support Zones:
43,950–43,900 → Intraday support
43,600 → Reaction low
43,471 → Demand base
🧠 Bias:
📉 Bearish Intraday
Failed breakout and loss of EMAs indicate weakness. A break below 43,950 could trigger another leg down.
US30 H4 | Bearish drop off pullback resistanceBased on the H4 chart analysis, we could see the price rise to the sell entry at 44,294.22, which is a pullback resistance and could reverse to the downside.
Stop loss is at 44,783.24, which is an overlap resistance that aligns with the 78.6% Fibonacci retracement.
Take profit is at 43,461.56, which is a swing low support that is slightly above the 61.8% Fibonacci projection.
High Risk Investment Warning
Trading Forex/CFDs on margin carries a high level of risk and may not be suitable for all investors. Leverage can work against you.
Stratos Markets Limited (tradu.com ):
CFDs are complex instruments and come with a high risk of losing money rapidly due to leverage. 65% of retail investor accounts lose money when trading CFDs with this provider. You should consider whether you understand how CFDs work and whether you can afford to take the high risk of losing your money.
Stratos Europe Ltd (tradu.com ):
CFDs are complex instruments and come with a high risk of losing money rapidly due to leverage. 66% of retail investor accounts lose money when trading CFDs with this provider. You should consider whether you understand how CFDs work and whether you can afford to take the high risk of losing your money.
Stratos Global LLC (tradu.com ):
Losses can exceed deposits.
Please be advised that the information presented on TradingView is provided to Tradu (‘Company’, ‘we’) by a third-party provider (‘TFA Global Pte Ltd’). Please be reminded that you are solely responsible for the trading decisions on your account. There is a very high degree of risk involved in trading. Any information and/or content is intended entirely for research, educational and informational purposes only and does not constitute investment or consultation advice or investment strategy. The information is not tailored to the investment needs of any specific person and therefore does not involve a consideration of any of the investment objectives, financial situation or needs of any viewer that may receive it. Kindly also note that past performance is not a reliable indicator of future results. Actual results may differ materially from those anticipated in forward-looking or past performance statements. We assume no liability as to the accuracy or completeness of any of the information and/or content provided herein and the Company cannot be held responsible for any omission, mistake nor for any loss or damage including without limitation to any loss of profit which may arise from reliance on any information supplied by TFA Global Pte Ltd.
The speaker(s) is neither an employee, agent nor representative of Tradu and is therefore acting independently. The opinions given are their own, constitute general market commentary, and do not constitute the opinion or advice of Tradu or any form of personal or investment advice. Tradu neither endorses nor guarantees offerings of third-party speakers, nor is Tradu responsible for the content, veracity or opinions of third-party speakers, presenters or participants.

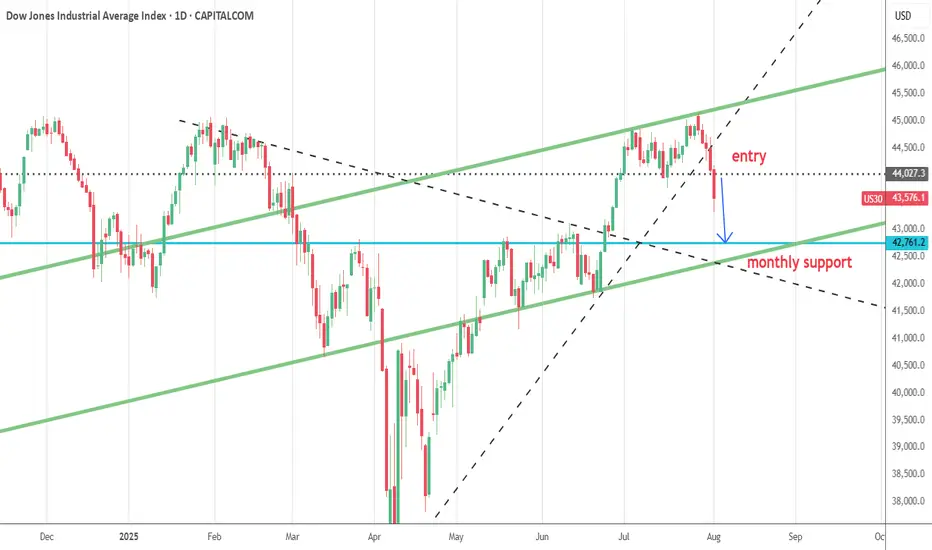
US30 TRADE IDEA 4 AUGUST 2025The US30 (Dow Jones Industrial Average) is showing signs of a near-term bearish bias after breaking down from its rising daily channel and rejecting at the 44,700–45,100 supply zone, which coincides with a key former support level now acting as resistance. From a Smart Money Concepts perspective, this zone represents a recent order block where institutional selling pressure originated, making it a high-probability area to look for short entries if price retests with bearish confirmation, such as a daily bearish engulfing candle, a long rejection wick, or a clear lower-high formation. The first major downside target lies around 43,062, aligning with an intermediate demand zone, with an extended target toward 42,500, where deeper demand and prior consolidation converge. Stops should be placed above 45,150 to invalidate the bearish setup. Conversely, if price drops into the 42,800–43,000 demand zone and shows strong bullish reversal patterns, there is scope for a tactical countertrend long back toward 44,700–45,100, provided that geopolitical and macro conditions turn supportive. Fundamentally, the market remains caught between optimism over potential Federal Reserve rate cuts later this year and uncertainty stemming from the Fed’s cautious, data-dependent stance. Geopolitical risks—particularly heightened tensions in the Middle East and ongoing U.S.–China trade friction—are adding to volatility and could weigh on global risk sentiment, especially if oil prices spike and inflation concerns reemerge. These risks, combined with political uncertainty in the U.S., favor selling into rallies until there is a clear shift in macro direction. Key events to monitor include upcoming Fed communications, developments in Middle East conflicts, and any major U.S.–China trade headlines, all of which could either reinforce the short bias or trigger a sentiment-driven reversal. For now, the preferred approach is to sell into strength near the supply zone with defined risk, manage positions closely around the 43,000 demand area, and remain flexible to flip bias if price action and fundamentals align for a reversal.

US30
In these conditions, the probability of reaching the target is usually **55% to 65%**, and the probability of hitting the stop loss is **35% to 45%**.
US30 H9 | Market OutlookPotential for a bullish pullback on the US30 H9 which could lead to a price movement towards the resistance level at 46.000. BUY levels from 44.100

US30: Bulls Are Winning! Long!
My dear friends,
Today we will analyse US30 together☺️
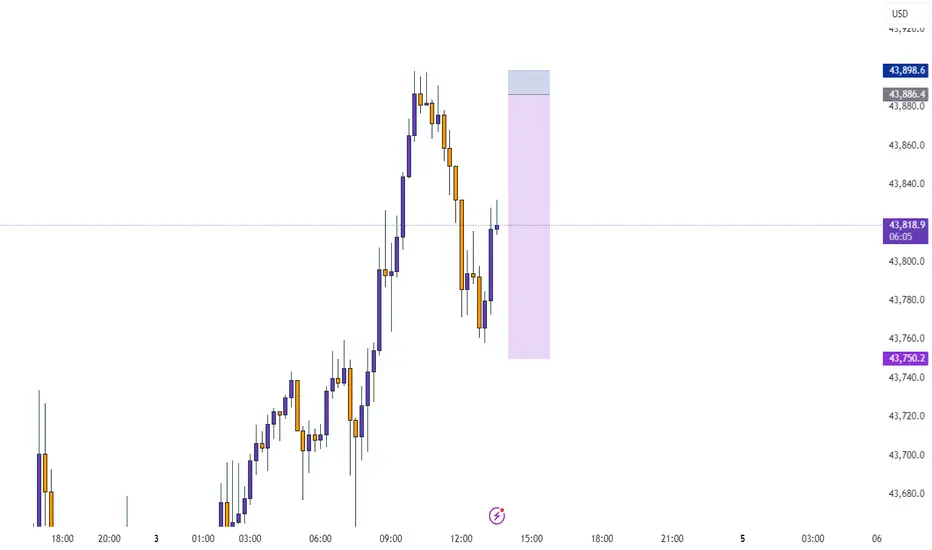
The market is at an inflection zone and price has now reached an area around 44,197.65 where previous reversals or breakouts have occurred.And a price reaction that we are seeing on multiple timeframes here could signal the next move up so we can enter on confirmation, and target the next key level of 44,301.05.Stop-loss is recommended beyond the inflection zone.
❤️Sending you lots of Love and Hugs❤️

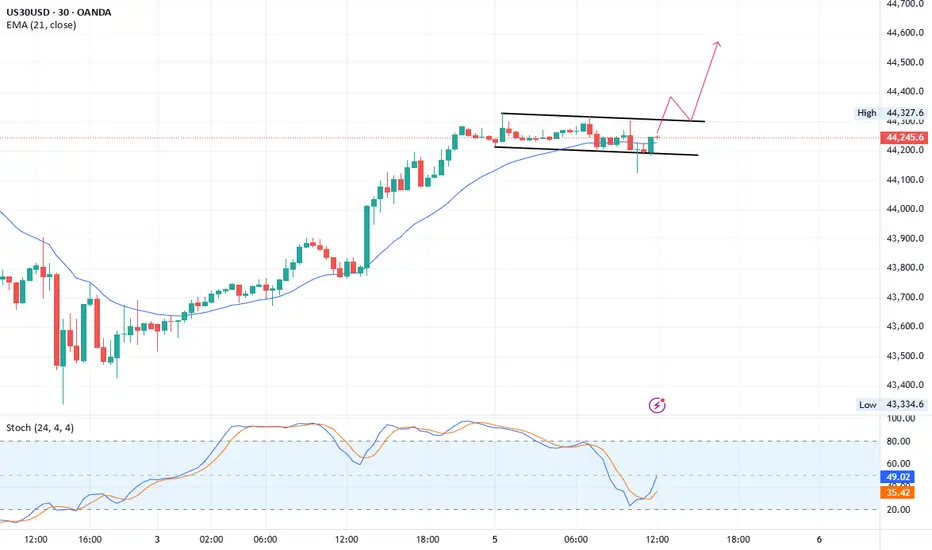
US30 Bullish flag patternUS30
M30 chart bullish flag pattern
Buy: current rate 44238
Stop Loss: 44125
1st TP: 44388
2nd TP: 44570
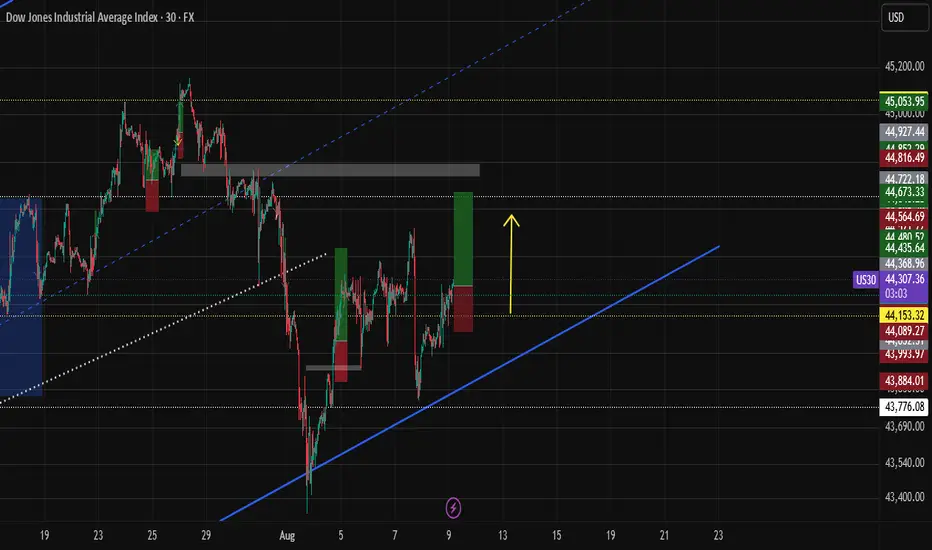
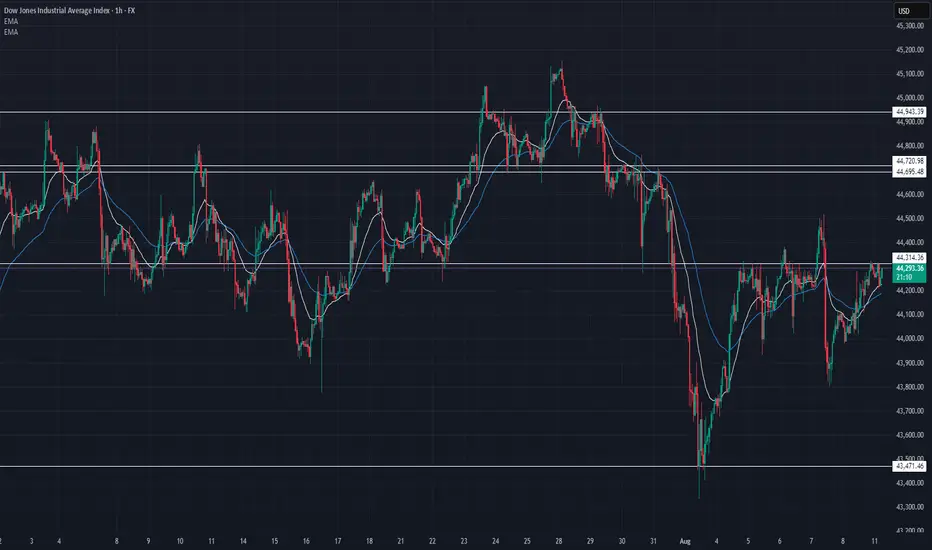
US30 Technical Breakdown – 08/11/2025📍 US30 Technical Breakdown – 08/11/2025
US30 is trading around 44,279 after a steady climb from last week’s 43,471 low. Price has reclaimed short-term EMAs but remains capped under the 44,314 resistance pivot. Bulls need a clean break above this level to target the heavy supply zone at 44,695–44,720.
A rejection at current levels could see price slip back toward 44,000, and if that fails, the next supports are 43,600 and 43,471.
📊 Current Market Behavior:
📈 Bounce from recent lows holding above EMAs
📊 Price stalling under key resistance at 44,314
🧱 Heavy supply waiting near 44,720
⚠️ Bulls in control short term, but upside capped unless breakout clears
📌 Key Levels:
🔹 Resistance Zones:
44,314 → Immediate breakout pivot
44,695–44,720 → Major supply zone
44,943 → Swing high
🔹 Support Zones:
44,000 → Psychological & structure support
43,600 → Reaction low
43,471 → Demand base
🧠 Bias:
📈 Neutral to Bullish Intraday
Bulls hold the advantage above 44,000, but sellers have defended 44,720 multiple times. Breakout or rejection likely to set the week’s tone.
Dow jonesDow Jones daily analysis
Time frame daily
Risk rewards ratio >3.5
Short position
Because price couldn't break the 45.048 again and earthquake in 5he east of Russia and Japan makes the markets drop down
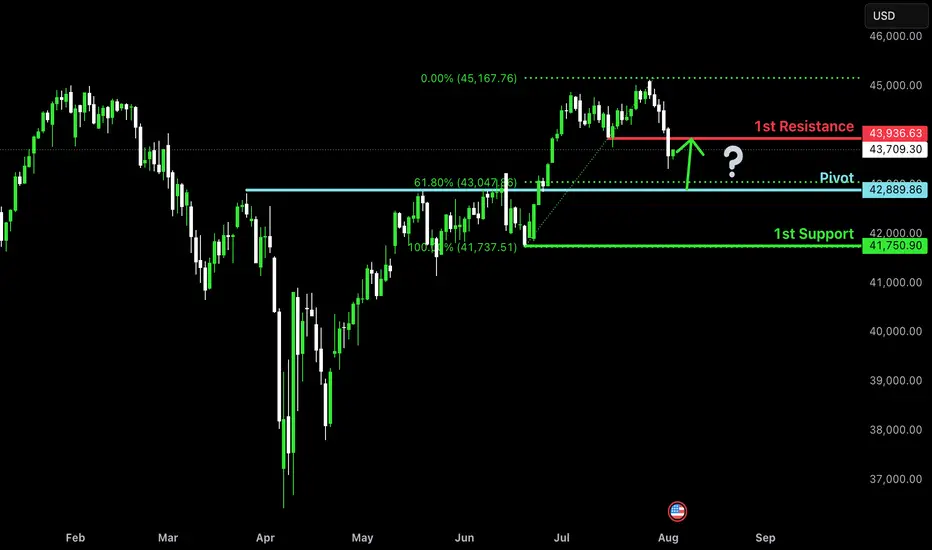
Falling towards pullback support?Dow Jones (US30) is falling towards the pivot and could bounce to the 1st resistance.
Pivot: 42,889.86
1st Support: 41,750.90
1st Resistance: 43,936.63
Risk Warning:
Trading Forex and CFDs carries a high level of risk to your capital and you should only trade with money you can afford to lose. Trading Forex and CFDs may not be suitable for all investors, so please ensure that you fully understand the risks involved and seek independent advice if necessary.
Disclaimer:
The above opinions given constitute general market commentary, and do not constitute the opinion or advice of IC Markets or any form of personal or investment advice.
Any opinions, news, research, analyses, prices, other information, or links to third-party sites contained on this website are provided on an "as-is" basis, are intended only to be informative, is not an advice nor a recommendation, nor research, or a record of our trading prices, or an offer of, or solicitation for a transaction in any financial instrument and thus should not be treated as such. The information provided does not involve any specific investment objectives, financial situation and needs of any specific person who may receive it. Please be aware, that past performance is not a reliable indicator of future performance and/or results. Past Performance or Forward-looking scenarios based upon the reasonable beliefs of the third-party provider are not a guarantee of future performance. Actual results may differ materially from those anticipated in forward-looking or past performance statements. IC Markets makes no representation or warranty and assumes no liability as to the accuracy or completeness of the information provided, nor any loss arising from any investment based on a recommendation, forecast or any information supplied by any third-party.
Shakeout On The WayUnlike the SPX, the DJI didn't make a higher-high. Why is this? I think partially because it's price weighted as opposed to market cap weighted like the Nasdaq or SPX. The other part would be CPI numbers.
So what's next for the DJI? I see hidden bullish divs long term and hidden bearish divs short term, this a common shake out tactic I see to liquidate longs and shorts. I'll be looking to load up on the trade at the bottom of the channel and play the range as it develops.
As always: stay calm, don't panic, and don't forget you can always use a stop loss
The fear and green index is at 74, when people are greedy be fearful.

US 30 Dow Jones Industrial Average Week 32 OutlookUS 30, along with related indices, is likely to range for most of the week with early sells to confirm the support of interest. Best interest is in the bearish sentiment right now.
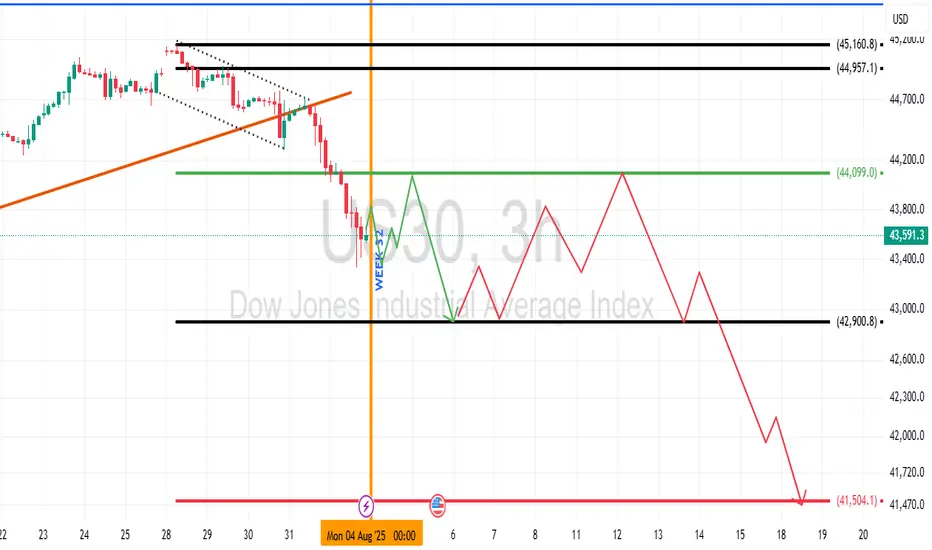
DowJones The Week Ahead Key Support and Resistance Levels
Resistance Level 1: 44390
Resistance Level 2: 44720
Resistance Level 3: 45100
Support Level 1: 43360
Support Level 2: 43140
Support Level 3: 42800
This communication is for informational purposes only and should not be viewed as any form of recommendation as to a particular course of action or as investment advice. It is not intended as an offer or solicitation for the purchase or sale of any financial instrument or as an official confirmation of any transaction. Opinions, estimates and assumptions expressed herein are made as of the date of this communication and are subject to change without notice. This communication has been prepared based upon information, including market prices, data and other information, believed to be reliable; however, Trade Nation does not warrant its completeness or accuracy. All market prices and market data contained in or attached to this communication are indicative and subject to change without notice.

Dow Jones Triple Top & Critical Trendline Break - Buy The Dip?Potential Tripple Top formation spotted on the Dow. This would represent a full fibonacci retracement, which leads me to believe a 38.2 retest is likely. If this 23.6 level can hold support and price does not close below the fib band (orange channel), then the bullish continuation to new all time highs can still happen in Q3/Q4 of this year. The clear trendline break dating back to April is very concerning (white line), leading me to believe more downside in the coming weeks.
Let me know what you think in the comments!
Thanks

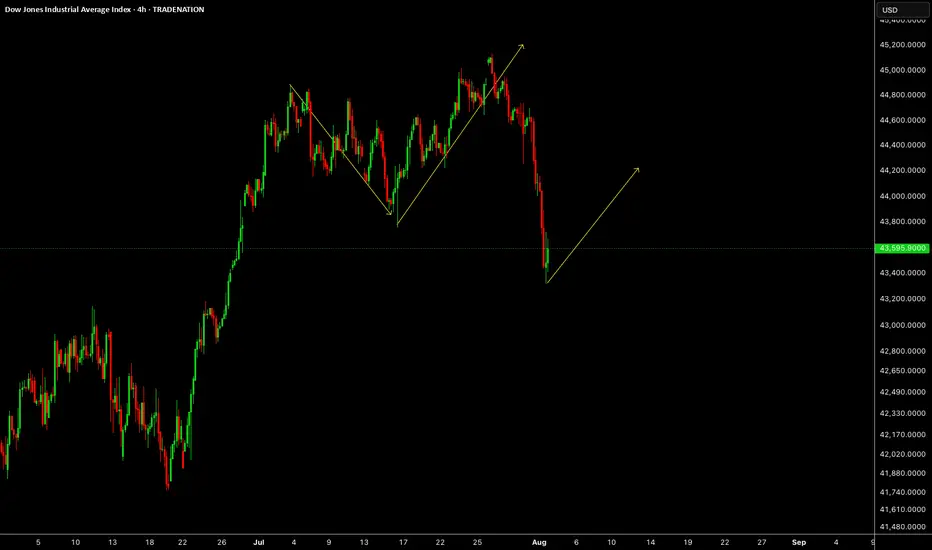
Dow Jones US30 Trend Analysis and Trade Plan Breakdown📈 US30 (Dow Jones) is currently in a strong bullish trend 🔥. This is clearly visible on the 4H chart, where we’re seeing a consistent pattern of higher highs and higher lows 🔼🔼.
👀 I’m watching for a potential long opportunity, especially since the higher timeframes remain firmly bullish 🟢.
🎥 In the video, we break it down:
A quick overview of the 4-hour structure
Then dive into a potential trade setup on the 30-minute chart ⏱️🔍
🧠 This is for educational purposes only and not financial advice ⚠️📚

US30 Swing Short!
HI,Traders !
#US30 keeps falling down
And the index broke the
Key wide horizontal level
Around 43924.6 which is now
A resistance and the breakout
Is confirmed so we are very
Bearish biased and we will
Be expecting a bearish
Continuation on Monday !
Comment and subscribe to help us grow !


US30US30 was expected to drop last week which is what market has done. This week we need upside correction or impulse.
Disclosure: We are part of Trade Nation's Influencer program and receive a monthly fee for using their TradingView charts in our analysis.