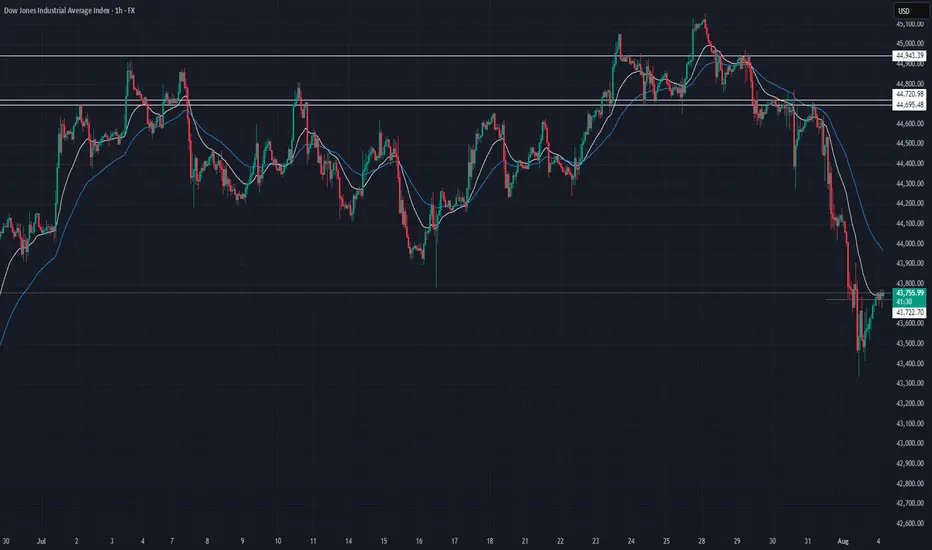
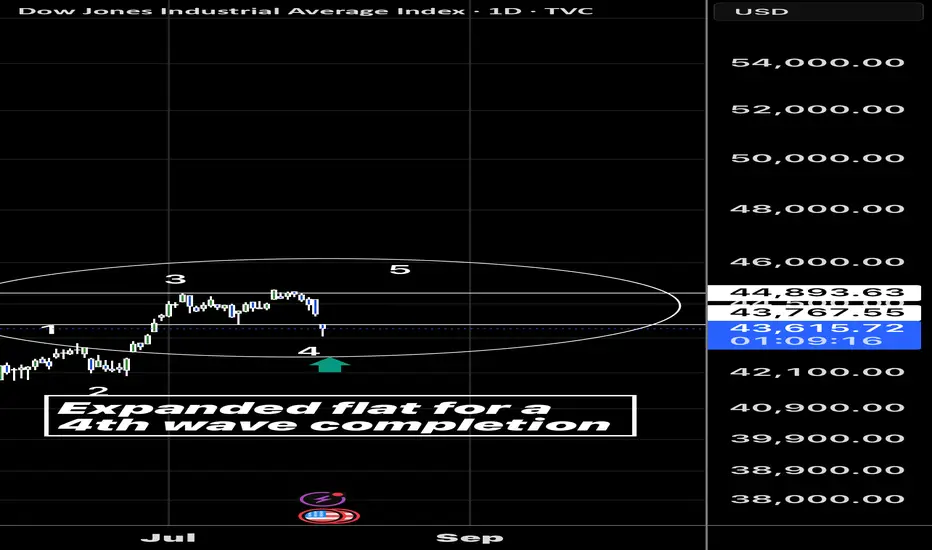
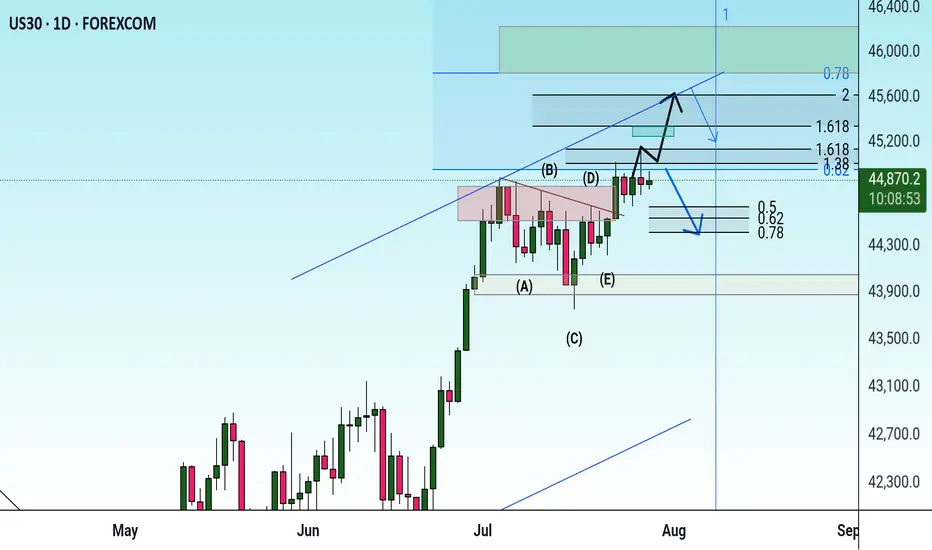
DJ30/US30 LONG Reason for trade:
1. Expanding flat in play
2. Equal highs (LIQUIDITY)
3. Currently at the order block area (Ready)
Entry: 43647
Stop Loss: 43386
Take Profit: 45246
Strategy: Wait for a 30 minute engulfing candle closure.
Once in profit of 1:1 R, place the trade at BE
Blessings, in CHRIST.
DJIA trade ideas


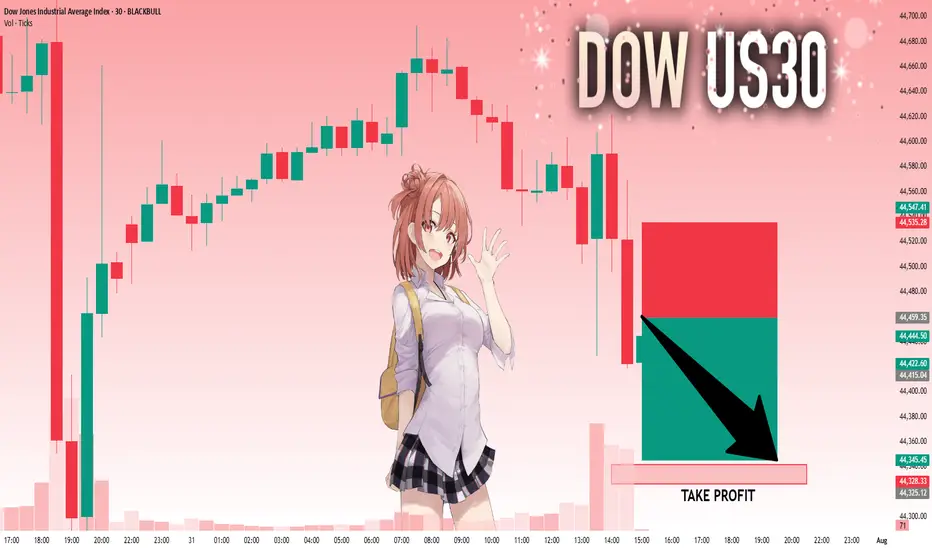
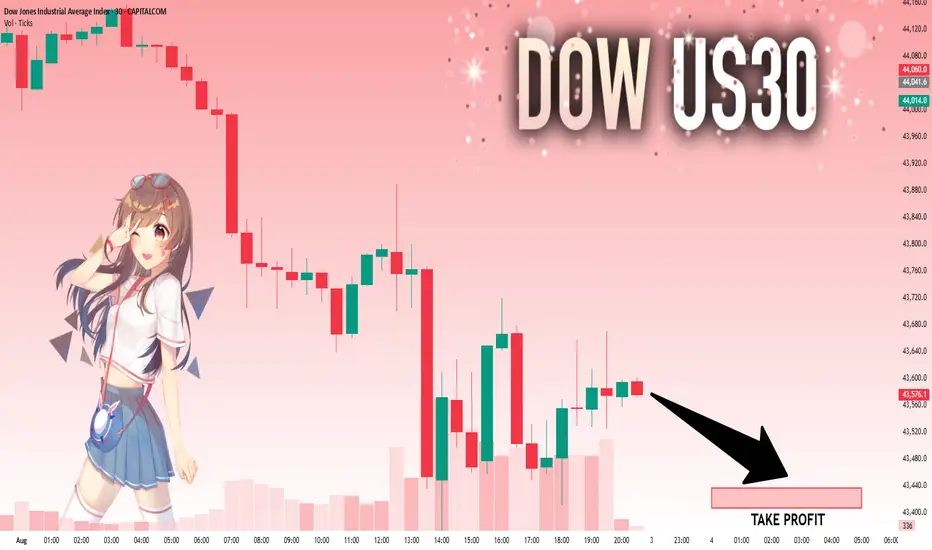
US30 Technical Breakdown – 08/04/2025📍 US30 Technical Breakdown – 08/04/2025
US30 sold off sharply, breaking down from the 44,600–44,700 range and diving as low as 43,500. Price is currently bouncing near 43,750, but the trend remains weak with lower highs and a breakdown structure intact.
The market lost its key support zone and is now attempting a weak relief rally. Bulls must reclaim 44,000 to avoid further selling pressure.
📊 Current Market Behavior:
📉 Sharp downside momentum
🔄 Small bounce after aggressive breakdown
🧱 Old support at 44,600–44,700 now acting as resistance
⚠️ Bearish structure intact unless reclaimed
📌 Key Levels:
🔹 Resistance Zones:
43,950–44,000 → Minor intraday resistance
44,600–44,720 → Major breakdown zone
44,943 → Swing high before selloff
🔹 Support Zones:
43,600 → Intraday bounce zone
43,500 → Recent low
43,200 → Next potential demand area
🧠 Bias:
📉 Bearish Intraday
Market still under heavy pressure with no major reversal signals. Relief rallies likely to be sold until key levels are reclaimed.
US30 _BUY RETRACEMENT-SELL CONTINUATION-HIGHER TIMEFRAME-FVGThe week of July 28th the market reacted off the resistance around the 45,097 level to the sellside creating a downward trend. On the Monthly and the weekly, the market has traded down into a higher timeframe FVG, possibly creating a buy model for the upcoming week. On the 4hour it's possible a continuation will occur to the sellside.

US30: Absolute Price Collapse Ahead! Short!
My dear friends,
Today we will analyse US30 together☺️
The in-trend continuation seems likely as the current long-term trend appears to be strong, and price is holding below a key level of 44,459.35 So a bearish continuation seems plausible, targeting the next low. We should enter on confirmation, and place a stop-loss beyond the recent swing level.
❤️Sending you lots of Love and Hugs❤️
Dow Jones August GameplanNow that the first trading day of August has printed, can one reliably forecast the possible month based on just the first day? I am inclined to believe that one can with a small amount of accuracy. Not perfect.
There are two types of monthly cycles when the first traded day is a bearish candle right from the open of the month.
Type 1 is a bearish trending cycle that trends lower and lower. It is then followed up by small number of bullish pullbacks halfway through the month before rolling back over and closing near the lows.
Type 2, more common, is when the first traded day is bearish right from the get-go as well, trades lower but reverses near the beginning of the month before trading higher than the open and forming a bullish bar.
So, in my opinion, there are only two probably outcomes for August.
Type 1:
Type 2:

US30: Will Go Down! Short!
My dear friends,
Today we will analyse US30 together☺️
The recent price action suggests a shift in mid-term momentum. A break below the current local range around 47,577.1 will confirm the new direction downwards with the target being the next key level of 43,436.6 .and a reconvened placement of a stop-loss beyond the range.
❤️Sending you lots of Love and Hugs❤️
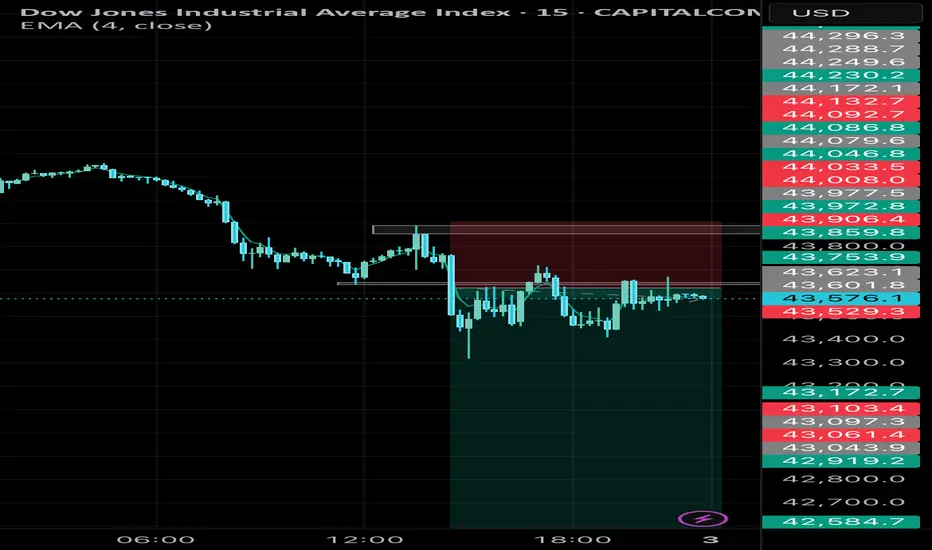
US30 (15M) – Bearish Reversal Setup, Short Opportunity📊 Analysis:
The US30 index on the 15-minute chart is showing signs of a bearish reversal after a recent upward push. Key technical observations:
1. Price Action & Structure
* US30 has been trading in a minor uptrend, but momentum is weakening.
* The latest 15M candles show lower highs forming near resistance, suggesting exhaustion in buying pressure.
2. Resistance Zone
* The price is rejecting a strong intraday resistance zone near 43641.90.
* Multiple failed attempts to break above this level reinforce it as a key barrier.
3. Target Levels
* First support target: 43206.96 – a minor support from previous structure.
* Secondary target: 41911.76.
4. Risk Management
* Suggested stop-loss: Above the recent swing high.
* Risk/reward ratio: Aim for at least 1:2 to ensure proper trade efficiency.
✅ Summary:
US30 on the 15-minute chart is showing a bearish setup.
⚠️ This analysis is for educational purposes only and not financial advice. Always use proper risk management.
Us30usd sellI entered a sell trade from the LS zone. The PEZ zones were all used up. I set the last one as my TP.

Expanded flat on the Dow for 4th wave completion? If it is we can see some new highs… a close back above 43760 today would set it up
US30 Bullish Bias!
HI,Traders !
#US30 went down and
Retested a horizontal
Support of 43775.2 from
Where we are seeing a
Bullish rebound so as we
Are bullish biased and we
Will be expecting a further
Bullish move up !
Comment and subscribe to help us grow !

US30 Robbery Blueprint: Breakout, Pullback, Escape Setup💎 Dow Jones Robbery Blueprint: The US30 Vault Crack Plan 💎
(Maximized for reach — within TradingView title limit)
🌟Hi! Hola! Ola! Bonjour! Hallo! Marhaba!🌟
Dear Market Robbers & Money Movers 🕵️♂️💰🚨
This ain't your average analysis — it’s a Thief Trader-style 🔥tactical mission🔥 aimed at the mighty "US30/DJI" (Dow Jones Industrial Average). We're talkin' about a precision heist with a full blueprint: entry zones, trap setups, and escape exits. Read carefully — this ain’t for the faint-hearted traders! 🧠🦾
🧠 Entry Zones (The Break-In) 📈
🛠 ENTRY 1: Crack the wall near 44700.00 – that’s the resistance gate. Wait for confirmation.
🎯 ENTRY 2: Sneak in at the Market Makers’ Trap around 43500.00 – a dirty zone where retailers get baited. Perfect time to strike long!
🧱 DCA/Layering strategy recommended. Stack those buy orders like a thief layering explosives on a safe. 💣💸
🛑 Risk Levels (Escape Routes/Stop Loss)
🔊 "Listen up, vault raiders! Never drop your SL until breakout is confirmed. If you jump early, you might land in a bear trap! 🪤"
🔐 Stop Zones (Based on Strategy):
📌 Swing Buy SL (2H TF): Place at 44100.00 for the stealth buy.
🏦 Institutional SL (Swing Zone): Drop it around 43000.00
🔐 Max Risk SL (3H TF): If you're deep, your last stand is at 39200.00
☝️ SL depends on your position sizing, number of entries, and risk appetite. Trade like a thief, not a gambler.
🎯 Heist Target (Profit Exit)
🏁 Escape Point: 46200.00 — or exit before heat rises! Don’t be greedy. Rob and vanish. 💨💰
🔥 Market Mood: Why the Heist Is On
"US30/DJI" is bullish AF — thanks to:
📊 Macro-Economic Wind at Our Back
📈 Institutional momentum
📰 Strong sentiment and intermarket flows
Check your chart radar: Fundamentals + technicals aligning = green light for robbery! 🟢
⚠️ Tactical Reminder: News Can Jam the Plan
📵 Avoid new entries during major economic releases
🛡 Use trailing SLs to protect running trades
Stay alert, stay alive. 💡
❤️ Support the Robbery Crew
Hit that 💥BOOST💥 — your love fuels our next mission.
Join us and ride daily heist plans with Thief Trading Style 🏴☠️🚀💰

Dow Jones Futures Edge Up Ahead of Fed, GDP & Tech EarningsDow Jones Futures Edge Up Ahead of Fed, GDP & Tech Earnings – Bearish Bias Below 44,770
Dow Jones futures rose slightly overnight as investors brace for a packed session. Key events include the release of Q2 GDP data before the market opens, the Federal Reserve’s policy decision in the afternoon, and earnings reports from major tech firms later in the day.
Yesterday, the Dow Jones managed to break below the ascending channel, which technically indicates a new bearish signal for today.
The price stabilizing below 44,770, along with an attempt to break the support line at 44,610, suggests a potential downward move.
Initially today, before the opening of the New York session, the price may attempt to rise toward 44,770 as a retest. However, we anticipate a decline afterward, aiming to break and pass the support level at 44,610, and then extend the drop toward 44,360.
The bullish scenario becomes valid only if the price stabilizes above 44,770. If it can trade above this level for a longer duration, it may rise further toward 44,910.
Key Levels
• Support: 44,610 - 44,360.
• Resistance: 44,770 - 44,910 - 45,100.

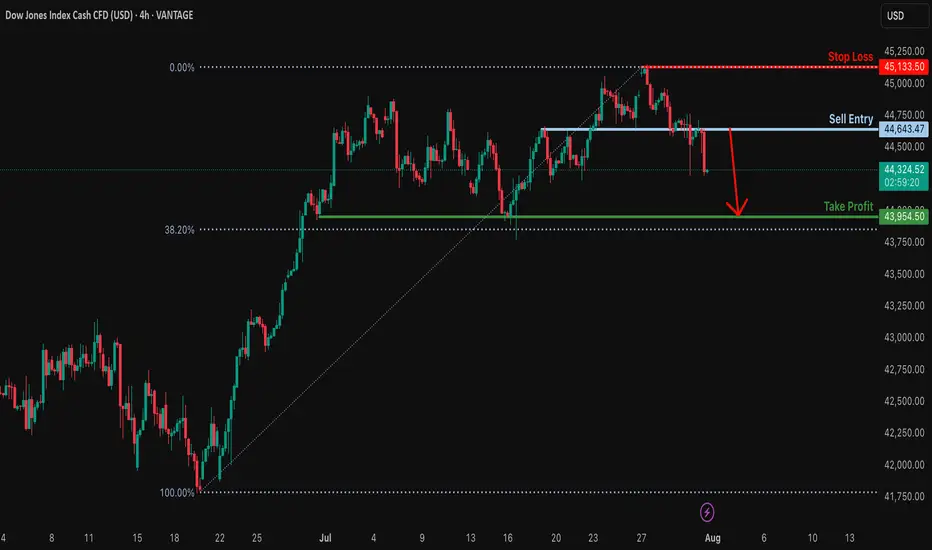
Potential bearish drop?Dow Jones (DJ30) has reacted off the resistance level which is an overlap resitance and could drop from this levle ot our takeprofit.
Entry: 44,643.47
Why we like it:
There is an overlap resistance levle.
Stop loss: 45,133.50
Why we like it:
There is a swing high resistance.
Take profit: 43,954.50
Why we like it:
There is a multi swing low support.
Enjoying your TradingView experience? Review us!
Please be advised that the information presented on TradingView is provided to Vantage (‘Vantage Global Limited’, ‘we’) by a third-party provider (‘Everest Fortune Group’). Please be reminded that you are solely responsible for the trading decisions on your account. There is a very high degree of risk involved in trading. Any information and/or content is intended entirely for research, educational and informational purposes only and does not constitute investment or consultation advice or investment strategy. The information is not tailored to the investment needs of any specific person and therefore does not involve a consideration of any of the investment objectives, financial situation or needs of any viewer that may receive it. Kindly also note that past performance is not a reliable indicator of future results. Actual results may differ materially from those anticipated in forward-looking or past performance statements. We assume no liability as to the accuracy or completeness of any of the information and/or content provided herein and the Company cannot be held responsible for any omission, mistake nor for any loss or damage including without limitation to any loss of profit which may arise from reliance on any information supplied by Everest Fortune Group.
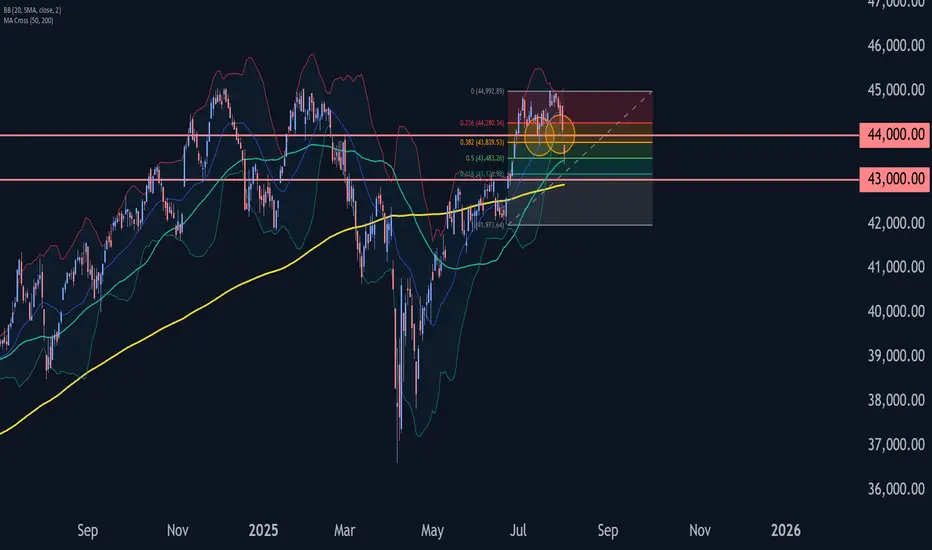
Dow Jones Wave Analysis – 1 August 2025
- Dow Jones broke the support zone
- Likely to fall to support level 43000.00
The Dow Jones index broke the support zone between the support level 44000.00 and the 38.2% Fibonacci correction of the upward impulse from June.
The breakout of this support zone accelerated the active short-term correction iv.
Dow Jones index can be expected to fall to the next support level at 43000.00 (target for the completion of the active correction iv and the former resistance from May and June).
US30 - BUYStrong selling pressure today as price has grabbed a ton of buy side liquidity. As we approach FOMC news tomorrow, I am expecting buyers to take back control and price reach Sundays opening price.

Possibility of uptrend The uptrend is expected to move in the specified direction and advance to the specified targets. If the indicator does not consolidate above the current resistance level, there is a possibility of a double-digit combination pattern. Then a correction is likely.
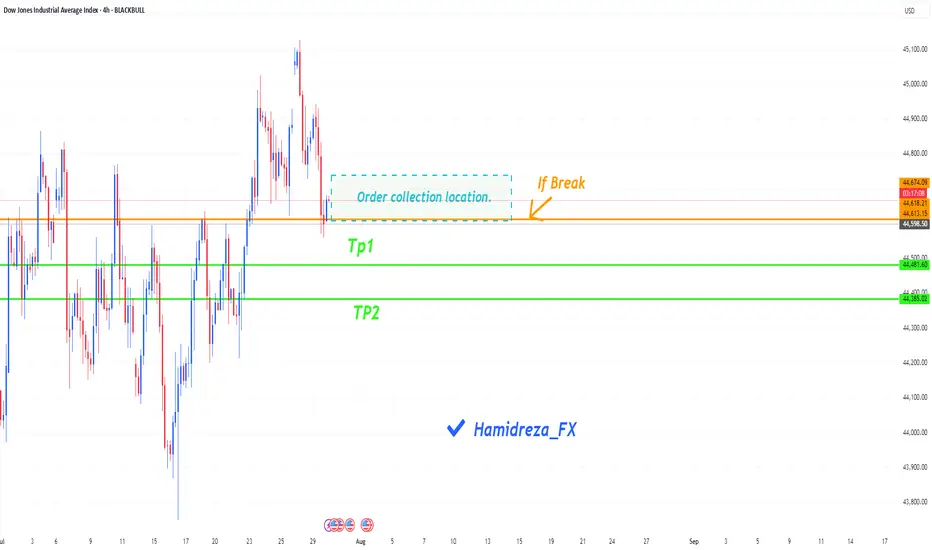
Will the Dow Jones continue its correction?
Hi everyone
The indicator may continue to correct itself by breaking the condition written in the figure (with an orange line). There is a blue box on the figure that shows the place where orders are collected. It is possible that buy orders will be placed in this area and then the downward trend will begin.
What percentage of the probability do you think there is of reaching the specified targets?
Be sure to follow me because you can make good profits from the market.
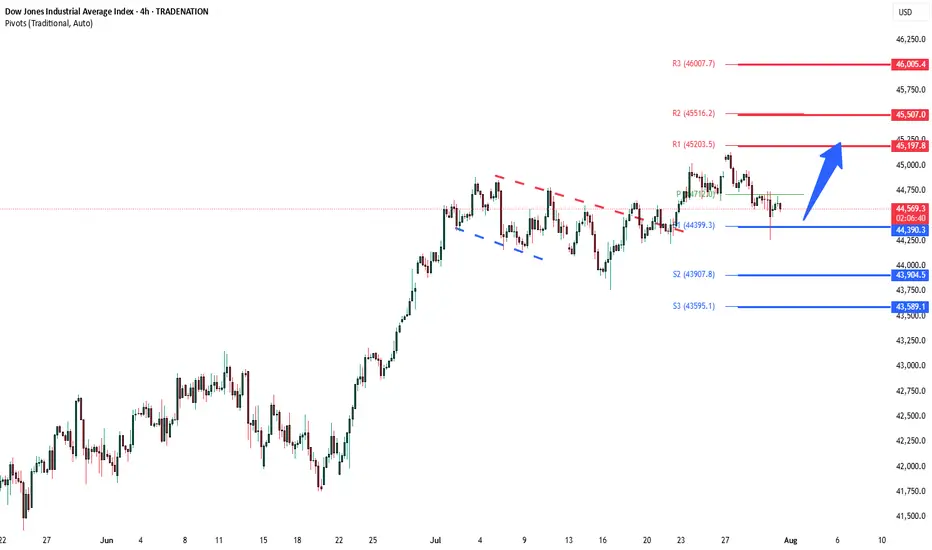
DowJones breakout retest supported at 44390Key Support and Resistance Levels
Resistance Level 1: 45197
Resistance Level 2: 45500
Resistance Level 3: 46000
Support Level 1: 44390
Support Level 2: 43900
Support Level 3: 43590
This communication is for informational purposes only and should not be viewed as any form of recommendation as to a particular course of action or as investment advice. It is not intended as an offer or solicitation for the purchase or sale of any financial instrument or as an official confirmation of any transaction. Opinions, estimates and assumptions expressed herein are made as of the date of this communication and are subject to change without notice. This communication has been prepared based upon information, including market prices, data and other information, believed to be reliable; however, Trade Nation does not warrant its completeness or accuracy. All market prices and market data contained in or attached to this communication are indicative and subject to change without notice.

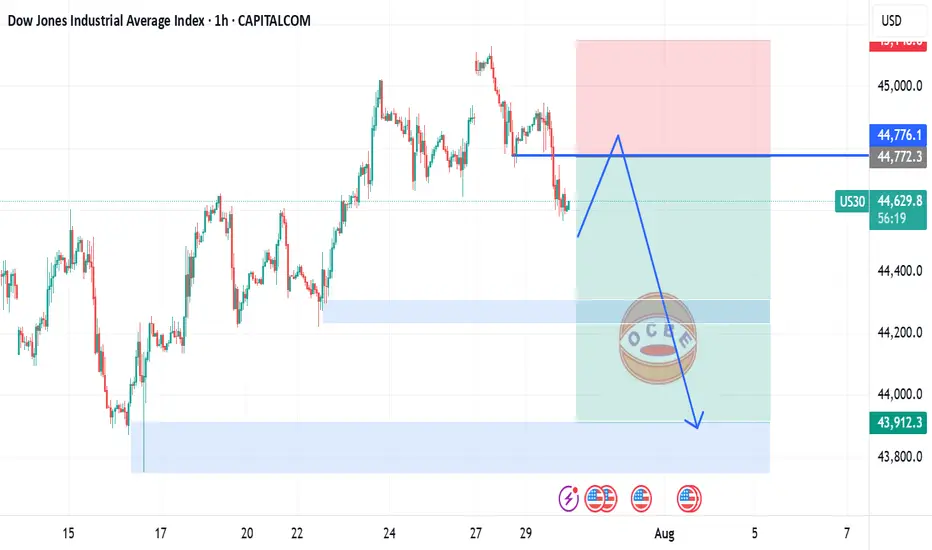
US30 short movePrice had broken our support level and hence i expect a rest to the new formed resistance before resuming its bearish move.
Do you agree with a big profit in US30?
Hello friend
Do you think the orange line will break?
What if it breaks?
Just wait and collect the money.
If you liked my analysis, please support me by liking, commenting and subscribing. Thanks friend
