DJT @ 3rd green wk. WHY it may be making abc zigzag downAlthough transportation looks bullish now with 2 green weekly close after a big plunger, I still think this is just the b counter wave & there is one more c wave down to my green zone. There are still overhead resistances at various VWAPs.
Transports, like IWM small caps, is a very impt leading indicator of our economy. With oil cost rebounding & labor difficulty adding to a slowing economy due to supply chain crisis,, things just dont turn around in a flash although medium & longterm is still bullish.
Transports usually peaks out way way ahead of SPX. With transports seem recovering, I think SPX will still make a new high in 2022.
Not trading advice
DJTA trade ideas

I'M WATCHING TRANSPORTSSome setups might be playing out here as we move further into 2022.
I'll be paying close attention to this market-leading indicator.
No trades currently, watch this space.

Dow Transports saying the crash is yet to comeI have done a 3 prong analysis on the Dow Transports VS the Dow Jones which are indicating a continued move down for the markets in the near future of 1-2 weeks. It could even be a crash.

Does Anyone Remember Charles Dow?Something interesting happened with the Dow Jones Transportation Average recently. Or, more precisely, didn’t happen. The S&P 500, Nasdaq-100 and Dow Jones Industrial Average all breached their October lows amid this year’s pullbacks. But Transports haven’t even come close to those levels.
Notice how DJT bottomed last week over 14,000. That was 1 percent above its trough near the end of the third quarter and start of the fourth quarter.
Turn back the clock a little further to the late 1800s, when Charles Dow famously noticed that railroads and shipping stocks could confirm moves in the broader market. In the current case, “Dow Theory” may be providing non-confirmation of weakness . And that could be bullish.
Second, consider the converging trendlines as DJT eased lower. Is that a falling wedge, another potentially bullish reversal pattern?
Finally, you have the bigger picture because Transports are a classically cyclical part of the market that often benefit from a strong economy . With Covid cases falling, the U.S. reopening and the spring/summer approaching, investors may view Transports as a potential beneficiary.
TradeStation is a pioneer in the trading industry, providing access to stocks, options, futures and cryptocurrencies. See our Overview for more.
Important Information
TradingView is not affiliated with TradeStation Securities Inc. or its affiliates. TradeStation Securities, Inc., TradeStation Crypto, Inc., and TradeStation Technologies, Inc. are each wholly owned subsidiaries of TradeStation Group, Inc., all operating, and providing products and services, under the TradeStation brand and trademark. When applying for, or purchasing, accounts, subscriptions, products and services, it is important that you know which company you will be dealing with. Please click here for further important information explaining what this means.
This content is for informational and educational purposes only. This is not a recommendation regarding any investment or investment strategy. Any opinions expressed herein are those of the author and do not represent the views or opinions of TradeStation or any of its affiliates.
Investing involves risks. Past performance, whether actual or indicated by historical tests of strategies, is no guarantee of future performance or success. There is a possibility that you may sustain a loss equal to or greater than your entire investment regardless of which asset class you trade (equities, options, futures, or digital assets); therefore, you should not invest or risk money that you cannot afford to lose. Before trading any asset class, first read the relevant risk disclosure statements on the Important Documents page, found here: www.tradestation.com .

DJT transports bottomed; suggest SPY will top=out on 21Feb2023DJT transports & IWM smallcaps are my favorite market leading indicators. They are the first to change market direction. Again on 24Feb, it was DJT that first made a long tail hammer…& it remained the longest.
This is most probably the bottom after DJT made a diamond at impt FIB retracement level & made last capitulation down for a bear trap.
Last 17 Sept 2018 DJT topped-out & SPY follows 16 months later on 13 Jan 2020.
Going to 2021. DJT topped in 1 Nov2021. Projecting forward 68 weekly bars would suggest that SPY may peak out on 21 FEB 2023.

Leading indicators reversed a reversalThe reversal observed previously appears to be washed out...
JNK broke down previously as expected, and exceeded target. No rebound as previously expected, but instead a further push downwards followed. MACD in bear territory.
IWM , DJT and VALUG all swent further down after breaking the support that bounced off earlier. MACD crossed and deep in bear territory. Turned out suspicion was well anticipated.
TIPS failed a support, went back to test but pushed further down. Bearish.
TLT is still not bullish, having pushed down further. Odd.
VIX spiked very hard to get a higher high, but did not close at a higher high. Indicative of bearish markets but not clear as yet.
/HG Copper futures are still held in a tight range and a breakout was immediately pulled back into range. MACD is in bullish territory.

Dow Transports - Weekly Sell SignalDow Theory Sell Signal is Active.
__________________________________________________________
The Primary Global Index used for Confirmation:
The Baltic Dry Index has collapsed from 5829 to 1764.
The Baltic Dry Index is reported daily by the Baltic Exchange
in London. The index provides a benchmark for the price of
moving the major raw materials by sea. The index is a composite
of three sub-indices that measure different sizes of dry bulk carriers:
Capesize, which typically transport iron ore or coal cargo.
Panamax, which usually carry coal or grain cargo.
Supramax, with a carrying capacity.
The Baltic Dry Index takes into account 23 different shipping routes
carrying coal, iron ore, grains, and many other commodities.
___________________________________________________________
The Dow Jones Transportation Average is a price-weighted average
of 20 transportation stocks.
As a Leading Indicator, the Dow Jones Transportation Average is a
Primary Indicator for the direction of the Dow Jones Industrial Average.
DJT Components:
Alaska Air Group, Inc. (ALK)
American Airlines Group Inc. (AAL)
Avis Budget Group, Inc. (CAR)
C.H. Robinson Worldwide, Inc. (CHRW)
CSX Corp. (CSX)
Delta Air Lines, Inc. (DAL)
Expeditors International of Washington, Inc. (EXPD)
FedEx Corp. (FDX)
J.B. Hunt Transport Services, Inc. (JBHT)
JetBlue Airways Corp. (JBLU)
Kansas City Southern (KSU)
Kirby Corp. (KEX)
Landstar System, Inc. (LSTR)
Matson, Inc. (MATX)
Norfolk Southern Corp. (NSC)
Ryder System, Inc. (R)
Southwest Airlines Co. (LUV)
Union Pacific Corporation (UNP)
United Airlines Holdings, Inc. (UAL)
United Parcel Service (UPS)

Transports at tipping point? (market leading indicator) Are transports at tipping point? They are market leading indicator. See Dow Theory

$DJT My fav market sentiment indicator.Last Friday the DJT bounced off October's gap up AVWAP and is looking to bounce off of these levels. It currently finds itself below the 20 day MA but above the VWAP mentioned before. If price is offered below last week's lows, then it's probable that it will test the 50 day MA, which could prove to be a resting area. Below the 50 MA has proved to be an area of increased demand lately, and it wouldn't be a surprise if the lows are taken out, just as it could be very probable that a rescue operation begins here and bounces up above the 20 day MA.

Leading Indicators point to more the obviousLeading Indicator panel update:
JNK - the topping pattern continues to play out for JNK, looking for a lower low, after the last lower high.
IWM - The Russell 2000 ETF failed a breakout late last year, and is about to break down of a support given the bearish weekly candle.
DJ Trans - a system Sell signal, and likely downside off the Dark Cloud Cover pattern.
Value Line - Similar outlook to DJ Trans, with bearish candlestick that failed to close the gap.
TIPS - Totally bearish Marubozu that broke two supports, with MACD bearish. This market forerunner is not boding decisively bearish.
TLT - Instead of the expected bullishness in a bearish market, we see TLT being dumped with a gap down marubozu.
VIX - still low, coiling to spike perhaps?
ES1! - The S&P500 futures had a Bearish Engulfing last week... indicative of a follow through downside in the weeks to come.
So... the leading indicators overall are bearish, and getting more so, with the S&P500 just became indicative of some real retracement potential in motion.

DJT Transportation Index buy 1546-15489 TP 15637, 15741Dow Jones Transportation Index in bullish mode. Buy on retracement in 1546.28 to 15489.81 zone. Stoploss at 15416.36.

Zig ZagZig Zag almost complete. The abc zig zag consists of 12345 that makes up A (Impulsive) and Abc that makes up B (Correction) and 12345 that makes up C (Impulsive).

BEAR IS ON $DJTTransportation index is a leading indicator of the general economy. it too ha also broke swing bottom. Just take a look at all the transportation stocks, majority of them are on a downtrend.
Bad time to come

Repeat of Covid Collapse?Bear Market? I'm just publishing this idea in case the market does drop and I can say I saw something. Maybe something will happen in the next 14-21 days (until 10/4 I think I marked on the chart)
These are just thoughts, nothing to take seriously...
Evergrande Not paying interest payments
- Potentially cause a ripple effect due to the large amount of US companies that are invested in China causing larger damage than expect?
- China pissing their pants and having the USA slip in the puddle
Increasing protests over Covid Vaccines
AMC MOASS
GME MOASS
Usual Mid September - October Bearish month
TLT Bullish Pennant as well, looking to break above 152.
What else am I watching?
TNX - 1/23/2020 bearish candle and break down people leaving
GOLD 2/13/2020 large moves up (money moving TO gold)
TLT 2/13/2020 startes to move up (money moving to TLT)
US10Y 2/18/2020 (started dropping)
JNK - Dropped same day as SPY (covid collapse 2/20/2020)
TLT/JNK chart - when this chart spikes like it did between 1/22/2020 on ward it shows big money ditching JNK to go to TLT (safe haven)
DXY - Strong dollar, weak stock market
Hedges?
TLT
Uranium (SRUUF/UUUU/URNM)
Cash
Or this could be a consolidation of sorts sideways.

TRANS - Trannies struggling in Trade WarsWith Containers hitting $35K for Transportation, an all time high...
Index of Global Real Economic Activity plunging...
All is well, move along.
Building a Container home?
Better buy a sailboat, it moves.
WEI has been cut on ONE HALF since April...
What is WEI ya say?
Weekly Economic Index - cut in half nearly in 4 months.
All is well... Move along.
GANN's 90 year Cycle, I believe, ends in March of 2022...
Ricky times ahead.

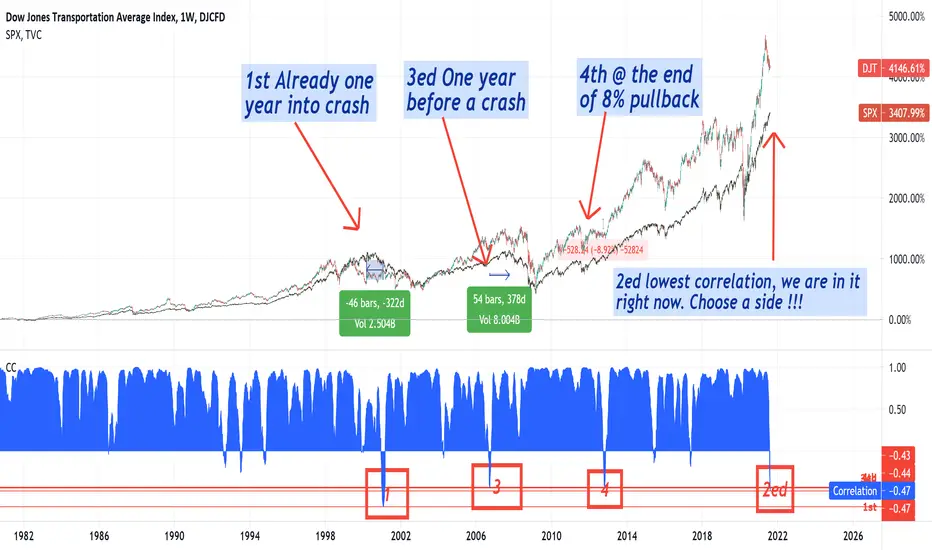
SPX since 1970, 2ed lowest correlation with Dow transportation! Nothing to add to the chart here, we are into the 2ed lowest correlation between Don transportation and SPX since 170
S&P500 Leading Indicator ScanRetracement clearly over, and now 5 out of 7 of my panel of leading indicators are suggesting that more crazy upside on the S&P500 is on the way. Only the High Yield Bonds and the Russell2000 have not taken off - yet.
On the contrary, we can visibly tell that the S&P500 is being stretched. It obviously is.
Nonetheless, expecting further gravity defying up spikes, at least for the next two weeks or so ... tread carefully!

DJT on a downtrend DJT is on a downtrend since i last posted on it last month. Of not all stocks in DJT are on a downtrend but the major ones are underperforming.
DJT touched on the MA100 line back in Jan 2021 and rose to ATH in May 2021. Since then it has declined around 13%. It is a lower high and low on the weekly and this indicates and confirms the downtrend unless this is broken.
UPS recently gapped down 3 days ago and has been going sideways (inside bars).
The transportation index is the driver of the economy and you need it to transport goods around. Perhaps the economy is slowing down a bit before moving higher. But with so many things are at ATH at the moment and very high valuations on few stocks, there could be a general corrections on the way, but might not be for a couple more months.
If the supply of credit is there by the Feds, this market will hold.

DJT ALERT!!!Dow jones transport still have plenty of room to the downside. While DJI continue to hold near the highs. Expect a big drop if the major index decide to follow the transport chart.

I moved to a net long at 90% in RAILSThe wave structure and cycle which was due to make a low due now has come in we will now see a new up leg and it will be lead by DOW TRANS But a warning if the djt only rallies back to a 50 to 618of this drop the last 5 weeks then a major CRASH will beset as I think into oct 10/20 .ALSO on oct 11 I will not be posting for about 6 weeks major reconstruction of my left shoulder and recovery. BEST OF TRADES WAVETIMER

𝗧𝗿𝗮𝗻𝘀𝗽𝗼𝗿𝘁𝘀 𝗨𝗽𝗱𝗮𝘁𝗲: $DJT Daily. 🐂-ish DivergenceBullish divergence at bottom of channel. Possible run to start on false #DeltaVariant fears?
$TRAN $IYT $JETS $AAL $UAL $DAL $LUV $FDX $EXPE $BA $SPY $ES_F $VIX $DIA $DJI #Stocks #Transports 🛫

Things may get uglyThe Transportation index generally is a leading indicator of the economy as you need logistics to move things around especially nowadays with online delivery.
The Dow Transportation index has fallen below the support level of 15317 and on June 10 when SPX hits all time high, the Dow index dropped and closed on the bottom. This generally is a bearish sign as the DOW is better represented of the US economy. Dow composed of major stocks from all industries except Utilities and Transport.
The Dow Jones index is weighted by the prices of stocks. SPX is weighted by the market value.
I guess time will tell

Not Slowing DownThe DJ Transportation Index is a leading indicator of the general stock market trend. It doesn't look like it's slowing down so for the moment, it's all bullish for the US market.
