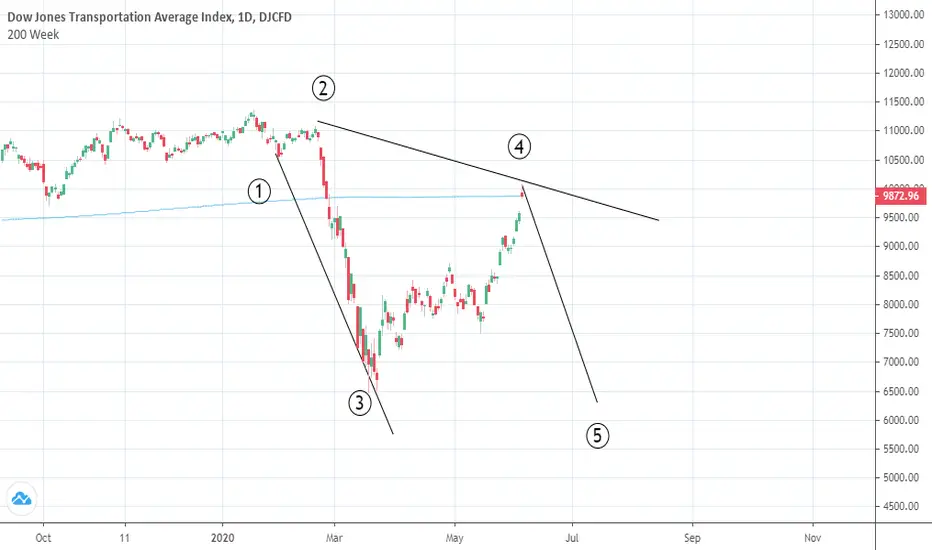
Potential top in DJTWe might be close to a potential topping formation in the Dow Jones Transportation Index. I view this Index as a leading indicator for equities. Connecting the trendline from April '09 to the bottom last year, and projecting this trendline on previous tops and extending it, we have come close to the top of it right now. A potential scenario i'm eyeballing is where the DJI (Dow Jones Industrial) makes a higher high, but the DJT fails to make a higher high ( a divergence, see this chart ). There have been several in the past where we have seen market corrections shortly after.
DJTA trade ideas

DJTDow Jones Transportation Average | Month-on-month, the trend has been higher with higher lows culminating in a rising wedge combined with negative divergence on the 7 and 14-Day RSI. We do however know that the upside breaks of rising wedges lead to trend continuations. A break above 12900 opens up a bullish break while a print below 12200 would see a bearish structure being triggered.

DJT - Elliottwave analysis - possible correction time DJT - The transportation index seems completed impulse cycle from major bottom and should correct down. It is a sell set up with invalidation level above 12636.55 for abc down cycle. The overall correction should go down up to the level around 4th wave low near 11200 or even lower. There is always a possibility of further 5th wave extension, so if price break above 12636.60 then it may go higher.
Give thumbs up if you really like the trade idea.

DJT - Elliottwave analysis - possible correction timeDJT - In 4 hr time frame, it looks like the impulse cycle has been finished unless, the 5th wave will extend further. If considering the impulse over, then there will be big correction expected down below 10913 at least. The commmon cycle between both options, is simple flat like abc correction as shown on the chart, which might go for minor new high and then expected to be reversed for C down.
Give thumbs up if you really like the trade idea.


DJ Transport (Dow Theory) says GGGood Game... the DJ Transportation Index has broken down the up trend line. Sell signal on the ATIS system should be out soon. And MACD is crossing down into the bear territory. The BMT had already given way in early October.
According to the Dow Theory, the DJ Transports is a leading indicator and well, expect the rest of the market indices to follow.

𝗧𝗿𝗮𝗻𝘀𝗽𝗼𝗿𝘁𝘀 𝗨𝗽𝗱𝗮𝘁𝗲: $DJT Weekly. False Breakout?Got the new highs, but a false breakout? If so, should revisit $10K or lower soon
$TRAN $IYT $FDX $AAL $UAL $DAL $LUV $EXPE $SPY $SPX $ES_F $VIX $DIA $DJI $YM_F #Stocks #Transports 🛫

DJCFD (DJ Transportation Average index).Macro BullishHi,
Some say that the DJCFD is a good indicator for the general stock market, eg SP500.
If DJCFD does well, the others will do well.
This past week, as per the weekly chart, we can see a solid bullish candle close above a main resistance.
Before its retests this resistance level, I am leaning towards it reaching to the upper part of this regression channel first.
OBSERVATIONS\THOUGHTS:
====================================================
> MACD shows convergence on the daily and the weekly chart.
> Using both the channel and the fib tool, the next target level has confluence with both of these elements.
> Chart below shows top resistance trend line with confluence to this target area.
> Hopefully this also gives the SP500 and BTC the spring it needs for the bull trend to continue, once again.
NOTE: DXY finished bearish last week, which gives extra weight to this thesis.
Please give me a like or tick for this post.
Regards,
S.SAri
NOTE the top resistance trend line has confluence on my target as well

Bullish Transports - Hidden Bullish Divergence (Monthly)MACD suggests a bullish breakout is underway with lots of energy to expend.
The cold hard Technical analysis is right there.

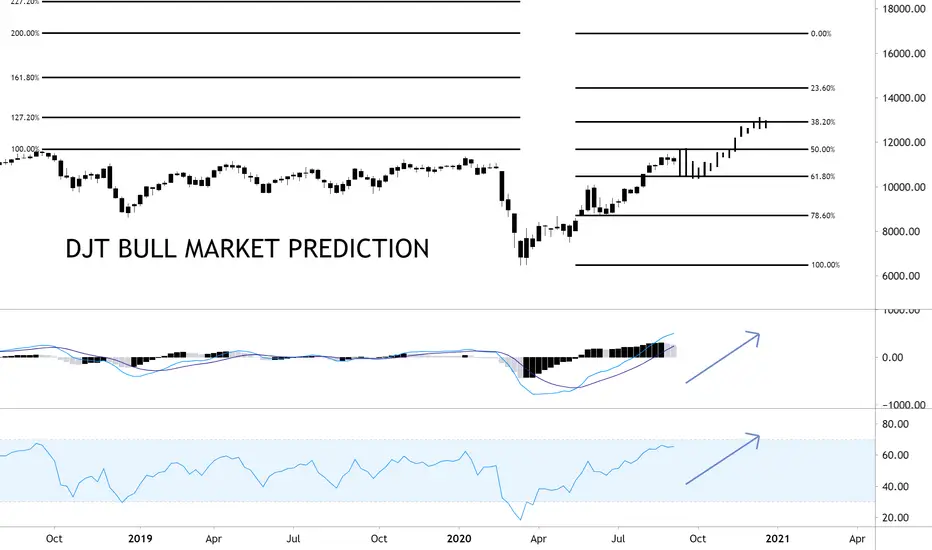
END OF A BULL MARKET IN DJT The two year cycle low in djt came in right on time in march at ax 1.618 and 50% and .382 at march low we are now looking for the BULL MARKET TO END AND ENTER A 18 TO 22 MONTH BEAR MARKET IN DJT AS WE REACH THE UPSIDE TARGET 12175 TO 12250 WATCH FOR A MAJOR SHIFT WITHIN 10 TO 13 DAYS AS THE FINAL BLOWOFF IS ENDING 2021 THE DJT ON AVG WILL BE DOWN 31 TO 42% BASED ON DATA BACK TO 1902


Dow Jones Transports Make All-Time HighToday 09/16/20 the DJT made a new all-time high. There are two Elliott Wave counts. The Prime count has Minor wave "3" at or near a peak.
The alternate wave count has Intermediate wave (5) at or near completion. If this wave count is correct it implies the DJT could be on the verge of a multi-year bear market.
Momentum indicators favor the Prime count which implies the DJT could make additional new highs in the coming weeks.
Weekly RSI is still not overbought and is at it's highest level since the rally began in late March. RSI almost always has at least one bearish divergence when used on stock indexes.
The lack of a bearish divergence implies higher prices.
MACD lines show no bearish divergence and only a tiny bearish divergence on the Histogram. These factors also imply higher prices.
Mark

The case for a retest of highsThis is as good as any wave count of DJT. As you can see the 5th wave is extended, and in the 5th wave, the iiird wave is the extended one. If we go by having completed wave iv of 5 just now then we should have one more rally to complete wave v of 5. The DJT is the best index to count waves imo.
I'm looking for the VIX to rally with CV stocks but this hasn't happened yet so with this wavecount there is still a possibility. This could also coincide with a possible 2nd wave of CV during fall/winter.

Transports Testing All Time Highs?If we know one thing in technical analysis, all time highs are not bearish. So if the Dow Jones Transports broke out to new all time highs, would that be bearish for equities? Or would that sound like the start of a new bull market? To me it sounds like the latter, so let’s have a look at the chart!
With a new weekly close, we are inches away from the all time high. The MACD is trending bullish and the RSI is not in overbought territory. These all point to the long term trend staying intact and remaining bullish. So if we assume that the market will remain bullish, what are some targets that we should have in the back of our mind? Well if we get really bullish, we could assume that the 200% extension would be a good target.
This is not the typical way to use Fibonacci retracements, but I find it very useful. I take the Fibonacci retracement tool from the top of the 200% extension all the way down to the swing low. This helps me envision key levels of retracement in the future based on my upside target. This aligns the 50% retracement, with the all time high (100% extension), and is a key level of resistance. If we fail at this point, a logical level for support is the 61.8% retracement. This would also be a higher low and would be bullish for the long term trend.
While the RSI and the MACD are both showing some exhaustion, there is just so much room for a higher low to be made that we have to remain bullish. Anything above 55 on the RSI is a higher low. If we fail at that level, anything above 40 is still a possible bullish trend. There are no bearish divergences to worry about either! So until the market tells us not to be bullish, we remain bullish. Keep your head on a swivel!
Happy Trading!
Truth TellerThe DJT provides the cleanest EW count out of all the indices. Here we see a clear 5 wave impulse. Other indices the count can get confusing, not DJT.

Salta conmigo! / Jump with me!With more lockdowns this is our best scenario.
-------------------------
Tribute to Tequila:
www.youtube.com
Good luck!

𝗧𝗿𝗮𝗻𝘀𝗽𝗼𝗿𝘁𝘀 𝗨𝗽𝗱𝗮𝘁𝗲: $DJT Weekly. Re-cross GoldenDeath cross negated and re-crossed golden. No new highs, but that may be tested before pullback
$TRAN $IYT $AAL $UAL $DAL $LUV $EXPE $FDX $SPY $DIA $DJI $YM_F #Stocks #Transports 🛫

DJT - ABC wave patternDJT has completed (X) wave in wxy double zigzag pattern after (W) major wave down in zigzag ABC in 4 Hr time frame from major top. Now it dropped in five wave impulse move in wave A, which is over today and correcting up in wave B. B wave might take 2-4 trading days to complete thereafter wave C will down. So bounce will be sell to go down. Within different sectors in US market DJT, XLF, XLP, XLE are good sell.

Expanding DiagonalCould be leading or ending expanding diagonal here, if leading next wave is wave 2 followed by wave 3 down.