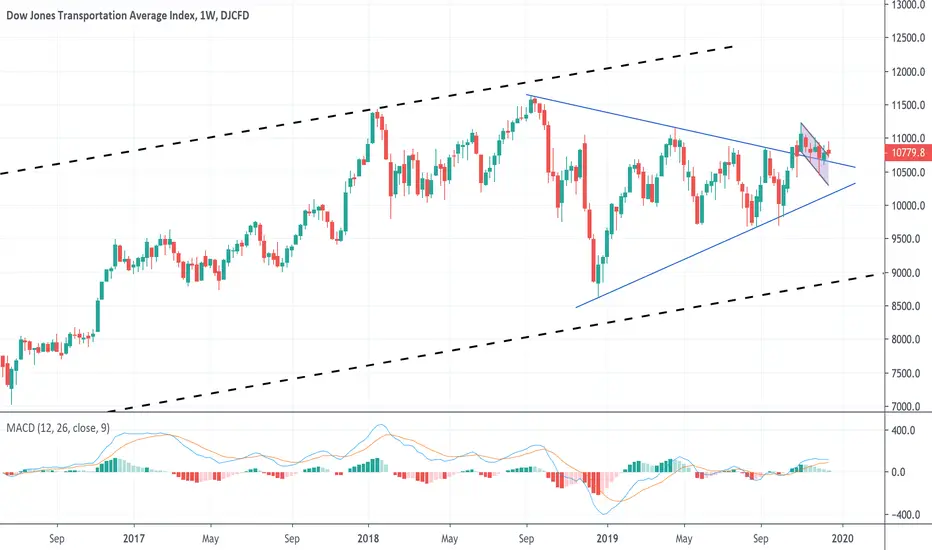
$DJT breaking out of bullish patternDJT breaking out of bullish pattern and testing UTL breakout. Bullish looking chart.
DJTA trade ideas
Bear flagbear flag given the current market climate looking for a continuation move this week into OPEX. No position.

DMT Bearish Divergences on RSI, rejected from Resistance Dow Trans looking bearsish. MACD crossed, bearish divergences on the RSI.

Couldn’t close above the resistance I believe we are on the tipping point towards this downside. We couldn’t break out of the resistance or previous highs. This will impact the SPX and DOW

Long Term DJT Elliott Wave Forecast - Target 12000This is a follow up to my prior DJT daily post.
From the DJT major bottom made in 2009 appears to be in the early part of the Primary wave "5" - boxed. If so,after completion it implies a multi - year bear market.
There's usually a relationship between waves "five" and "one". Using a Fib ratio of .236 of the percentage growth of Primary wave "1" -boxed
1.637 growth rate x .236 = .386
A growth rate of .386 + 1.00 = 1.386 x 8636 Primary wave "4" bottom targets DJT 11973.
The rising trendline connecting the January and September 2018 peaks cross 12000 in the first quarter of 2020.
Broad price target zone 11960 to 12070
Broad time target January to May 2020
Mark


DJT/DJI - At the Top of this Year's ChannelJust noticed this today and thought I would share. Something to keep an eye on.
Any thoughts? Not to sure what to make of it.

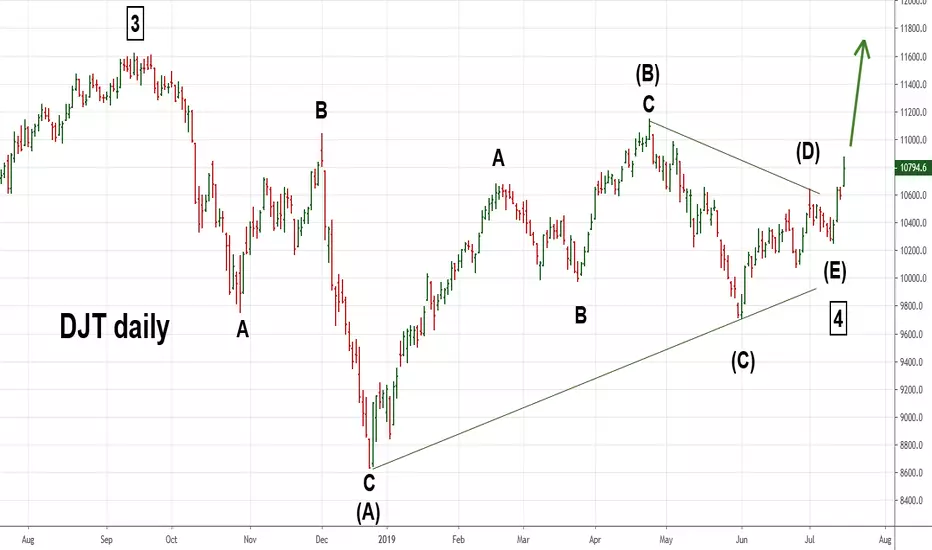
DJT Has the Clearest Elliott Wave PatternToday 11/5/19 was a very important day for the DJT. It broke above important resistance at 11148 made on 4/24/19 labeled as (B).
My 7/16/19 DJT post speculated that the DJT may have completed an Elliott wave - Horizontal Triangle. As it turned out the Triangle appears to have been still under construction.
The current H - Triangle has 50% Fib relationships between wave (D)/(B) and (C)/(A).
Daily Stochastic has a bullish crossover, and room to run on the upside.
If this count is correct the DJT is in a post triangle trust up that could move it well above the all-time.
IMPORTANT - Even if you don't trade DJT you need to watch the index because it has the clearest US stock index and can act as a road map for other indices.
My next DJT post will examine the long term DJT Elliott wave pattern and upside target.
Mark

DMT Important weekI'm using this as a leading indicator for SPX and SPY. Must see how this week will play out with FEDS on 31 OCT

Trannies Roadmap Oct 2019This looks feasible..fundamentally dunnu how it will happen but markets are what they are

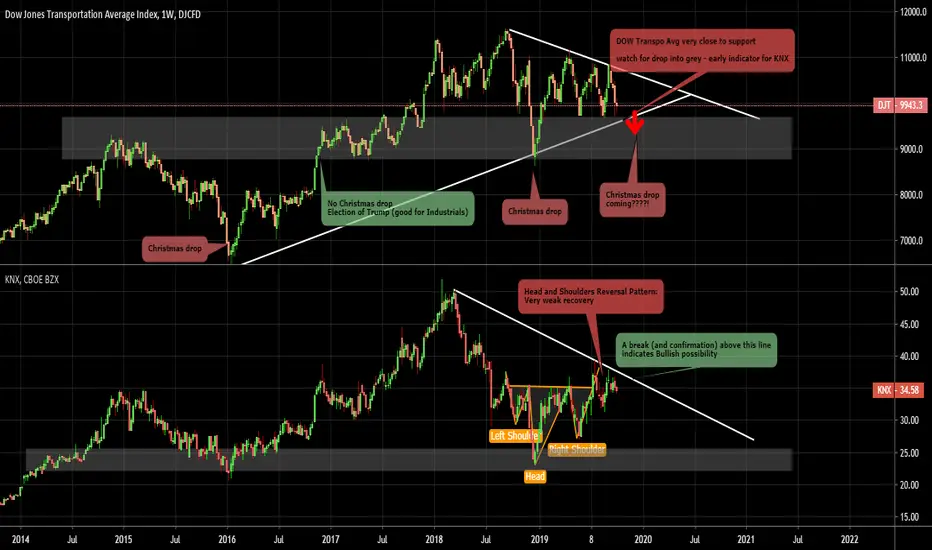
DJT and KNX Comparison 1 Week timeframe ---Composed this for a friend---
A comparison of a large trucking company and the DOW Jones Transportation Index. Using the DOW index to look for early signs that can affect the smaller logistics components.
I am bearish (negative) on Industrials. Why? At the most Macro -- President Trump does not want war, but, Congress is too divided for comprehensive infrastructure rebuilding.
Also at the macro level I'm very bearish on many mainstream stocks, at both DOW and S&P500 exhibit multi-year topping pattern - and, my opinion only stay afloat with accounting tricks.
other factors:
Overland transportation is (to a degree) dependent on vehicle sales - and I believe sales of new cars and light trucks have topped.
American consumer appears to be maxed out, and topping as well. Less need for movement of consumer purchases.
Long term - some (National) moves to grow food locally - and have less of the "2000 mile salad".
Trade war - less movement - more tariffs/ higher costs for non necessities.
What would make me bullish?:
a huge war
a huge natural disaster of an entire region - necessitating a national effort to keep that region supplied.
Cost cutting with new technology (no drivers?)...? not sure about this one...

DJT looking heavier and HEAVIERThe chart says it all. Continuously watching DJT and RTY for economic indicators pointing towards overall slowdown.
Both -Nas and SP500- made new ATH's, while the latter RTY and DJT (DowJonesTranspo) lagged and were unable to re-capture ATH's.
-------RTY and DJT appear to be spilling over. ------
Watch the levels, trade accordingly and most importantly.
We are market AGNOSTIC. We move with , NOT against.

Market TrendsDJT
A market in a broadening formation is said to be lacking intelligent sponsorship and out of control - a situation usually in which the public is excitedly committed and which is being whipped around by wild rumors. E&M


Dow theory in play and it suggest a gloomy outlookClassic Dow theory suggest a downtrend ahead and the outlook may look gloomy as the Transportation has not been making new highs and instead it makes new low. Beside that, there is a high probability that the transportation will break the diamond top pattern.

More Sell Off A HeadWe ended up breaking to the downside! The weakness in Transport telling us that we are in a Recession or Heading to one!!

DJ Transport v IndustrialDivergence seen with the transport trending down and industrial trending up, is this a warning sign?

Dow Transports are Surging UpThe Dow Jones Transportation Average (DJT) looks like it has completed a multi- month Elliott Wave Horizontal Triangle, if so it could now be in the early phase of a post triangle thrust up. A thrust is usually measured by the widest length of the triangle which in this case is wave (A) = 2986.80 points. This is added to the termination point of the triangle - the bottom of wave (E) 10260.30 + 2986.80 = 13247.10 as a possible bull market top.
For confirmation,all that is needed is to exceed Primary wave "3" boxed at 11623.60 top.
An alternate bull market top can be calculated by taking wave (A) length of 2986.80 x .618 = 1845.80 + 10260.30 = 12106.10 alternate bull market peak.
Time target late August early September 2019.
Mark
DMT 1M CHARTLet's see breakout - down or up - towards support or resistance. Both outcome will be interested compared with production companies.

DJT Bullish (if pullback occurs)DJT move since 24 December looks like an impulsive 5-wave pattern (With RSI divergence). Retracing to 10k is possible with coming earnings reports and profit taking. 10k - 9.5k will offer good risk/reward ratio. It would be wise to keep an eye on this.

