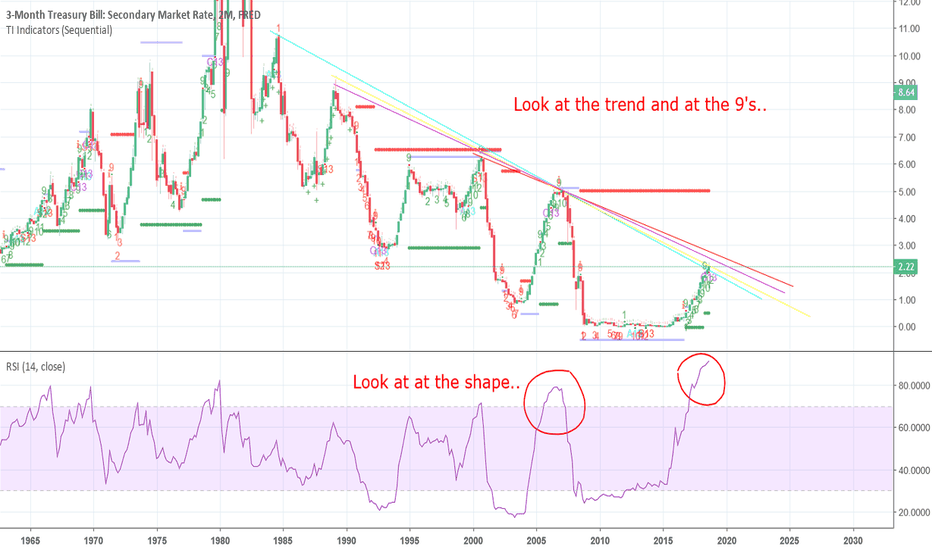
Downtrend sell short SP500 NASDAQTraders, both the 3-month Treasury Bill rates and the S&P 500 are showing signs of a correlated downtrend, similar to patterns observed in previous market downturns like 2002 and 2008. Treasury rates appear to have peaked and are now starting to drop, which historically signals a shift to a risk-off environment. This usually leads to capital flowing out of equities and into safer assets, often preceding economic slowdowns.At the same time, the S&P 500 has shown weakness, dropping over 2% recently due to poor manufacturing data and growing economic concerns. With the Fed potentially cutting rates soon, there's increasing volatility, particularly in tech stocks, which reinforces the likelihood of a substantial market correction. Prepare for what could be a prolonged downtrend based on these signals.
DTB3 trade ideas
Rate hike indicator: the 3 month treasury The reason for Friday's massive market selling is said to be because of the Fed's message that the rate hike is coming.
Seems that it may just be broad market selling after a period of complacent low VIX and broader overvaluation.
For confirmation that the rate hike is coming I'll be watching the 3 month treasury rate closely for signs.
A move from .30 to .55 would seem reasonable over the next several months if we are to see 25 bps increase for 2016.
In 2015 the 0.25% rate increase was starting to be priced in by late October into early December.
The CME Fedwatch tool currently shows the futures are betting on 58% chance of rate hike by Dec.


