Fed Funds Rate cutting cycle showing 2.40% of cutsShowing 2.40% of cuts as perspective of how fast federal reserve cuts rates.
FEDFUNDS trade ideas

Fed Funds Rate 1955 to 2019 with rate cuts Chart of rate cutting cycles with percentage and time to end of cycle (bottoms).


The last time the FED starting cutting Rates..... Please have a look at the last time that the FED began lowering rates; they began with 25 basis points, and they ended at ZERO percent.

FedFunds Rate Predicition is In Tact!Back in March of 2019 I put this out there...and here we are, getting a rate cut today !


Yield Curve Inversion or Planned Implosion?Fed Funds rate divided by the value of the Dow Jones Industrial Average. Seems to be that the DJI is where they are stashing wealth after each crisis. The process would allow them to tank an index like the Dow, buy it up cheap because everyone and thing sold recently and then they fill all their cracks with stolen money. What do you think?
And we were told that war is profitable. Straight up theft is way more profitable....lol

The Next Recession Is Right Around The CornerMonetary Policy is a funny thing, when times are good we raise rates to prevent the economy from overheating and when times are bad we cut rates to help stimulate the economy. But what if it is interest rates that are leading the economy and not the economy leading interest rates. In that case interest rates would paint a very interesting picture.
In my opinion it is interest rates that lead the economy. By lowering rates you entice debt and consumption and by raising rates you cause the inability to service debt and a subsequent recession ensues. It is obvious when looking at this chart of the US Federal Funds Rate that a drop in rates causes a larger debt load and then rates are raised until debt is so un-serviceable a recession begins, to which the response is to cut rates again even lower which does nothing but entice more debt. its a self fulfilling cycle all the way to zero, and soon negative interest rates.
This chart in conjunction with the fact Gold is breaking out, the US stock market indexes are forming a peak, the yield curve has inverted and interest rates around the world are falling once again kick starting the next easing cycle all points to the beginning of the next recession being right around the corner.
This is not financial advice, just be careful out there.


Real Cost of Money vs Recessions When interest rate manipulation goes too far. This coming recesssion/depression looks like it could be a bit deep

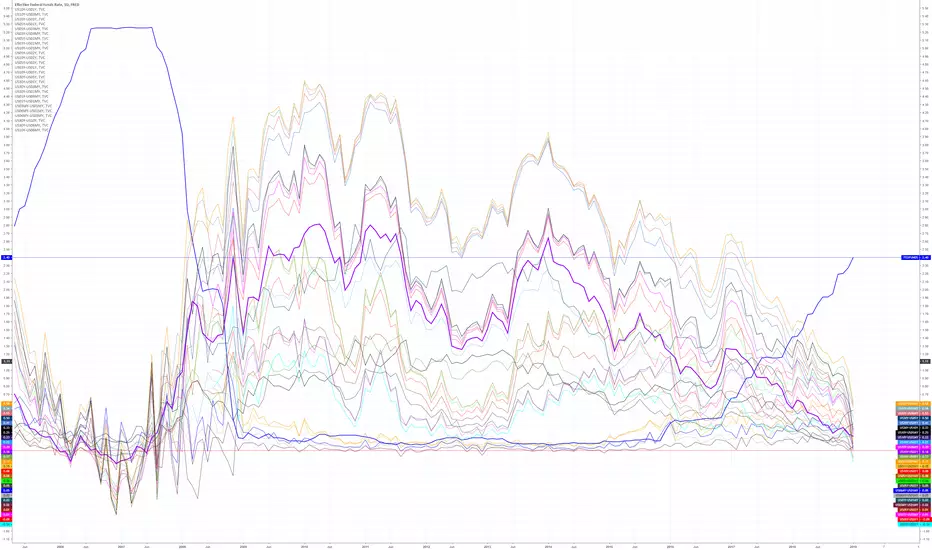
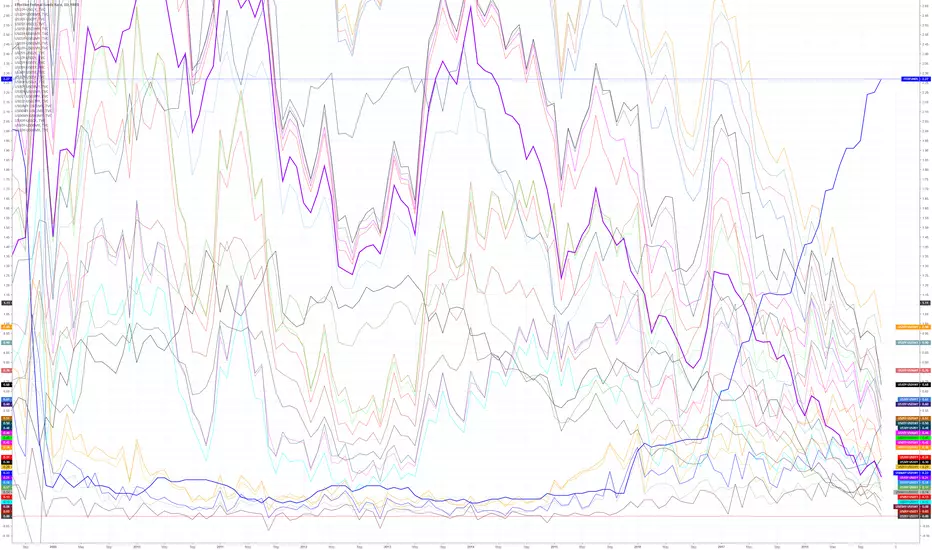
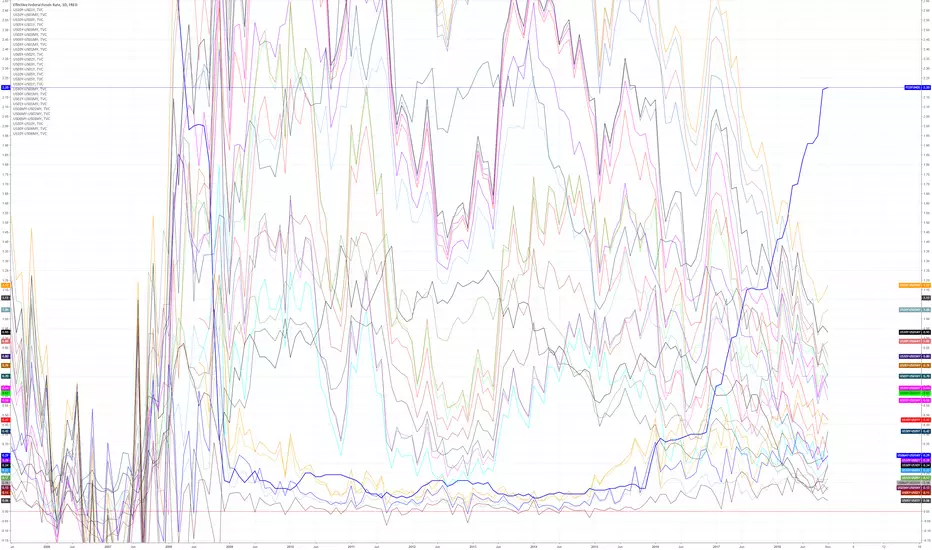
Global Central Bank Interest RatesGlobal Central Bank Interest Rates of Major Central Banks
Made using Quandl

Fed Funds Rate threatening to break-thru decades-long downtrendIf this trendline is broken, it means higher rates and panic in the credit market. Notice also that the last two times (in 2000 and 2007) that the funds rate challenged this line was the beginning of major market declines.


Interest rate and recession correlation?Just an idea based on higher highs in us equities v lower lows in fed interest rate, tracking from the 1980's. Currently overbought and heading for trend line. Recessions followed the last three touches which were overcome by sending interest rates lower each time. Are we headed for negative interest rates in 2021-2022?

Mar 2020 Fed Funds Futures vs Actual Fed Fund Rate...Mar 2020 Fed Funds Futures vs Actual Fed Fund Rate... its a pricing a rate cut, as Mar 2020 Fed Funds Futures get below actual Fed Fund Rate

3-1 and 5-1 year yield curves inverted todayRecession ahead. Media is all about FUD today with "sources cited" for trade talk delays. Such BS manipulation that is allowed by the SEC. Very difficult to patrol when their pay is by the elites who control the media.
Yield curve inversion tracking updateI thickened the most important indicator of 10yr-2yr thickened purple... almost there!
Once yield curve inverts you can expect recession to already have started to possibly a wait at most of 2 years... given the fundamentals globally I think recession will happen much much sooner than any central bank will admit. It's to everyone's interest to delay the official word on recession and doctor each countries' global GDP data to kick the can down the road as long as possible.
Fed Funds Rate TargetI applied Renko chart to weekly trend of Fed Fund Rates and drew a trend line on the past pivot highs. It looks like the normalisation of interest rate will end at near 3%...

Just Want to Make a Prediction for my future selfI believe that interest rates will go and surpass 3.5% by 2019. At that point it'll rise a little more then either one, skyrocket, or two they will try to lower rates to neutral again, then it will skyrocket. I believe my generation will experience stagflation.

Yield curve inversion tracking - almost there...Slowly but suredly we are approaching multiple sections of yield curve inversion. The data from TV feeds does not show the 3/5 and 2/5 YR yield curve inversions yet as reported last week on mainstream media using other data.
Why I Don't Follow TA Anymore and Why Bitcoin Isn't That SpecialOnce again, the chart should be self-explanatory, but I thought maybe some users would be too young to be familiar with some concepts, or simply uninformed. Being concrete 0.00% , the reference rate given set by the Fed is an inflation target. Inflation is a controversial topic, but both sides have points in favour. Inflation is happening, and the logic for it is to encourage spending. Likewise, when a reserve currency rises, the competing assets, prominently stocks, tend to slow down. The opposite is also true: if the interest rates are high enough, during a period where economic stimulus is required, central banks can turn dovish and make people want to get rid of their currency, making them spend and avoiding stagnation.
In this chart I marked the 5 financial crisis that are relevant to Bitcoin's study. The dotcom bubble rose while regulations were lax and a crypto-like craze not only reached nerds, but anyone who had a bank account. Without any actual knowledge of investment, the stock market inevitable bubbled out of its mind. You can see that the dollar was rising leading up to the dotcom crash. This happens because EM move their funds into dollars, since Wall Street is denominated in USD exclusively.
After 8 years, a special kind of derivative asset, the CDO, swamped the market and undermined the credit system. In simple words, the world was full on ghost money and it only took the first bank to file bankruptcy to trigger a chain of unpayable debt.
This idea of ghost money was an inspiration to create Bitcoin: money that can absolutely be anything but ghost.
After the 2008 bubble was under control, Bitcoin -1.06% found its way into the public. Even if it wasn't as accessible, due to regulations put in place after 00 and 08, as well as the intrinsic difficulty of joining the market, the rise wasn't shy. With confidence of having found the bottom, people bought the dip.
Then came 2011, when some after-effects of 08 hit France's credit ratings, subsequently spreading to the rest of Europe and hitting the nerve of the US as well. The slump didn't last long, but it can't be ignored.
Moving forward we find the 4th financial crisis: the rise and fall of emerging markets and oil 0.48% price crash. Still an after-effect of 08, these two events are intertwined. After the global economy picked up pace again post-08, countries like Russia and China experienced a "catch-up" rally. Anyone in the industrial and engineering sectors will quickly understand why oil 0.48% prices would be so relevant in this context. However, like any explosive (un intended) run, some pullback happens after the economy overshoots its actual capacity. It was during the start of 2014 that the demand for oil 0.48% pulled back significantly. Unlike other commodities , oil 0.48% has its own economic category, since it basically fuels the world. The 2014 fall was cemented when Russia invaded the Ukrainian border, bringing international sanctions that strongly affected its GDP. All of these things together incited an exit from EM currencies and stocks into the dollar. During this period, the Fed rose interest rates to keep a balance between the dollar and the stock-market-turned-safe-haven.
Near the end of 2015 things finally settled down, and the "Golden Bull" kept running up. Most of you will be familiar with the 5th financial crisis of 2018, lead by the Turkish lira. This was accompanied by further concerns raised by Argentina, Brazil, India, and South Africa. It was shortly before this began that Trump's administration opened the doors for a trade war. A trade war with China is sure to hit the stock market. It's obvious to anyone with eyes and has read "Made in China". Almost a year after the talks began, the dust has settled. The EM mentioned above haven't fully recovered, but the panic has gone down a lot, including the extreme talks of a war.
That brings us to today. If the aforementioned economies continue their way, and Powell does take the global situation into account, we could see buyers relaxing on the dollar and letting investors move back into financial assets. My personal belief is that the overall situation has tranquilised, and buying stocks and crypto at this point would classify as buying the dip. Of course, I do not have a crystal ball, and for all I know Italy may lash out and trigger some panic across the eurozone. I'm not a hedge fund manager, and neither is anyone of you. None of your ideas or charts will move the market, and getting angry at other users for disagreeing will get you nowhere. Bitcoin -1.06% halvings are mostly insignificant. Hashrate wars are short term. Protocol exploits and exchange hacks impact the slope, but not the direction.
Let me know if I incorrectly narrated some historical event, and I will gladly rectify.

Fed Funds rate danger/crash zone reachedRefer to my old tweet: twitter.com to see trendline resistance where markets unravle as fed funds reach resistance at asset bubble territory. You simply can't have a fiat debt system and not keep running into this issue. It's fundamental.
