Every cycle since 1970 has whispered the same sequence...Every cycle since 1970 has whispered the same sequence...
➊ Fed pivot (rate cutting cycle)
➋ Recessions + jobless claims uptrend
➌ Gold vs the stock market uptrend
That’s when commodities explode and outperform.
ICSA trade ideas


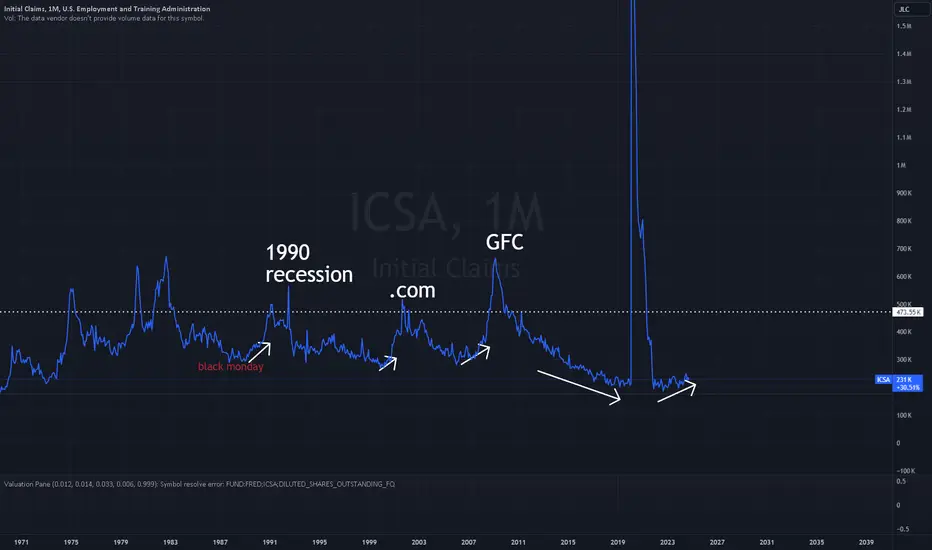
Initial Claims and RecessionsNaturally during recessions we experience huge unemployment numbers, but interestingly enough on the reversal of the highest employment locally on each hill, that reversal can signify the top of the recession, aka the bottom of the market.
Labeled are examples from recent financial crisis.
Canada leading the way...As Canada started to cut rates, in reaction to increasing unemployment...
It is leading the way for the next US recession.
Tic toc...
#recession #fomc #boc #fed #unemployment

Jobs, Gold, Spx and Rate Cuts!Initial jobless claims breaking out have a tendency to pressure the @federalreserve to start a rate cutting cycle.
Those puzzle pieces falling into place increase odds for a NEW precious metals complex bull era.
#jobless #recession #fomc #gold #silver #miners #spx

gold & silver miners + initial claims#Gold and #Silver miners waking up, smelling a possible bottom in US Initial Jobless claims.
Still a long way to go. #inflation #recession #fomc

My recession roadmap scenario...My recession roadmap scenario:
1) Jobless claims creeping up will spook the Fed
2) They will then cut the Fed fund rate
3) We then later declare a recession was/is happening
#Gold, #Silver and #Miners will enjoy the recovery.

10 year yields and jobless claimsHas US initial jobless claims (adjusted for total population) ever been this low?
Precious metals will flip current head winds into tail winds once US initial jobless claims enter their secular bull cycle.
Still very early.
#Gold #Silver #CrudeOil #Uranium #Miners #Inflation

gold bottoms in the ABYSS of the recessionsWho else noticed #jobless claims last uptick?
Until #gold and #silver breakout, #recession possibilities are more present.
#fintwit #inflation
Is gold sensing trouble?
gold had trouble here

Initial claims and fed fund rate cutIt has begun.
We can't be too far now from the PIVOT (Fed Fund Rate CUT).
Now watch crude oil and the precious metals. They have been pricing in a lot of this ahead of time. Lets see how much more needs pricing in.
#gold #silver #crudeoil #copper #platinum #uranium

SPX Monthly Log Chart since 1967US initial jobless claims HISTORICALLY low.
Tops in US equities are forged at those levels.
FED will only "try" to save the day AFTER initial jobless claims breakout.
That is the "last nail in the coffin" for growth stocks.
#fintwit #spx #fed #fomc $arkk #meta

United States Initial Jobless ClaimsWhere United States initial jobless claims go, so will gold & miners.
Now, back at breakout line last seen in 1970, 1972 and 2020.
#patience #fintwit #inflation #gold #spx #fomc

Chart defined stagflationThis chart has #stagflation written all over it.
If initial claims are back at 50 year lows. Seriously, do you think it's going down even more?
What did gold & silver do in the 1970s?

CPI x SPX x InflationHere is a chart that shows the correlation between the market (SP500) Inflation and Jobless numbers. Jobless numbers is the golden indicator of economic strength though there are many others I look at, and many more economists look at. For our purposes, Jobless numbers show the strength of the economy. We want a LOW number. We can see jobless numbers have been on a slow decline since the pandemic with a slight curve up over the last 2-3 months. Just like with stocks, we want to use our moving averages (One of our TOP indicators) to see if we have broken a trend. We can see with the Jobless numbers, the 50 day moving average is below the 200 day. This typically means bearish but keep in mind low = good with jobless numbers. So we actually WANT the 50 below the 200. The easiest way to remember is the 50 days relationship to the 200 determines the short term trend. If its above, the etf/stat is heading up. IF its below its heading below. Simple. Using this logic, the jobless numbers are in bullish territory. Inflation is a metric we want to see head lower. Its quite apparent its on a rampage. This is bearish for the market outlook as eventually, if left uncontrolled, this will impact businesses bottom lines and show in earnings.. The market is heading down as we can see. So in summary, the economy is strong but inflation is rampant. The strongest relationship we can see is between inflation and the market. We know this is the number one market mover right now.


SP500 vs Jobless ClaimsSP500 vs Jobless Claims
Maximo Jobless Claims = Minimo SP500
Recuperacion de la Data de Empleo ha acompanado la recuperacion del indice SP500
Maximo Jobless Claims 6.867K

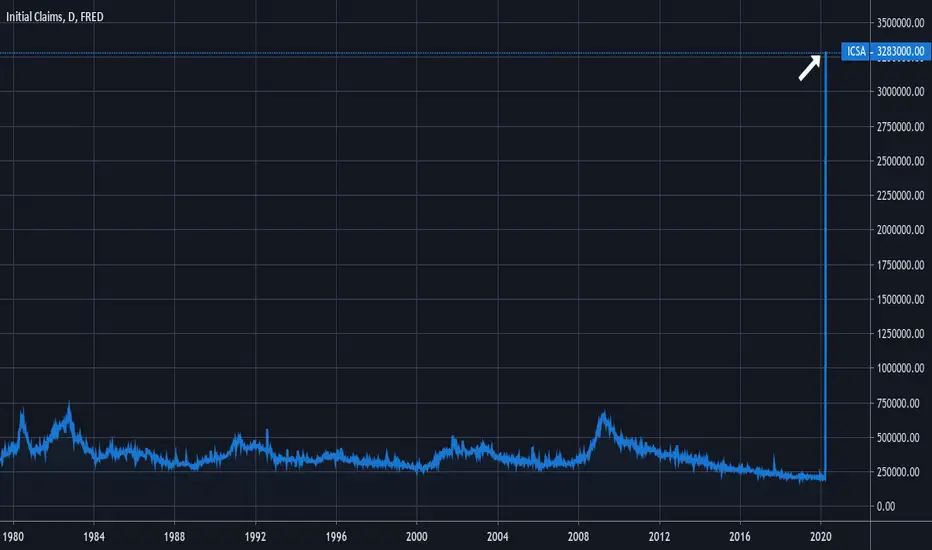
US ICSA Unemployment Weekly Initial Claims is at 6m per week The maximium FRED:ICSA since 1967 has not been more than 1m weekly (not even during 2008 or 2001), now in 2020 the US is at 6m per week (see FRED data here: fred.stlouisfed.org).

How To Chart Economic Data Like Jobless Claims or GDPCharting economic data can help you learn more about the macro world and see the bigger picture. This chart shows weekly Initial Jobless Claims in the US. In other words, it shows you how many people are filing for unemployment each week. The big spike, which has never been seen before in economic history, shows what the COVID-19 slowdown did to the economy in just one week. It is unprecedented.
You can chart Jobless Claims and much more. To get started, open a chart, go to the search box, open the dropdown menu, and then find the tab furthest to the right of the drop down called Economy. In this area, you will find many different types of economic data that you can chart from GDP to ISM and more. Most of the data comes from FRED and is US related, but please write us in the comments if you want to see other forms of data.
We hope you enjoyed this quick chart and tutorial and we look forward to sharing more! Press like if you enjoyed it or please comment below to share your thoughts.
That is the unemployment indicator ICSA, is this really real?I believe will see the biggest crash in the history, i hope only the indicator is wrong!!!

United States Jobless Claims for Thursday, 3/26 - 12:30:00 (UTC)Based on research compiled by SouthBay, for tomorrow's historical data print for jobless claims.
The SouthBay data shows a 66% y/y drop in hiring (-44% week-over-week), with the heaviest concentration in... . In 2009, when jobless claims were surging at a comparable rate, they were running at 600k initial claims per week. But we didn't have complete shutdowns then.
The number will be slightly lower than actual because of late filings and government processing (the scale will be more than can be handled).

UNEMPLOYMENT INSURANCE WEEKLY CLAIMS TO THE MOON!!!In about an hour 7:30 CST we are going to see something we have never seen before....
With the COVID-19 starting to take significant hold of the U.S. economy I believe this week we will see a massive rise in unemployment insurance claims that will translate to massive unemployment. My current estimates are anywhere from four to eight million if you use Canada as a proxy. This is 5 to 10 times the largest known weekly claims data (700K) and is a direct result of the precautions made for COVID-19. I don't believe this number is anywhere close to being "priced in" and will take the market.
Why?
As of the February's Employment Situation Report the total unemployment rate was 3.5% with 5.787M people unemployed and 158.759M employed for a total civilian labor force of 164.546M.
If you input my most conservate estimate of 4M newly unemployed people, developed off Canada's already published data, that would shift unemployed people to 9.787M. Assuming there isn't a large shift in the civillian labor force, that would change the unemployement rate from ~3.5% to ~5.9% in effectively one week. If that trend continues, as it usually does, we would see unemployement definantely surpassing the 2009 GFC of 10% and we could reach or even surpass the peak from the Great Depression of 24.9%.
I know that there has been a few articles on this printed over the past couple of weeks but most of my "non trading" friends weren't even thinking about the level of unemployment COVID-19 will cause. Also when this news hits new outlets it will make every working american pause, take notice, and become fearful that they too may lose their job. I think this because it is how I feel and it is a real possibility I lose my job like many other hard working people.
UNEMPLOYMENT INSURANCE WEEKLY CLAIMS
Estimates for 3/26
4-8 million
Last week 3/19
281,000
Report Link
Stay safe....
just_a_guy
Disclaimer: The opinions and ideas presented by just_a_guy are for informational and educational purposes only and should not be construed to represent trading or investment advice.

US Now in Official Recession! May Lead To Debt Crisis Meltdown!On August 13th, 2019, I said this in my recession analysis:
"I think will be born out of the next recession. And I believe that the next recession is most likely less than 18 months away."
-Referenced analysis attached blow-
Here we are, roughly seven months later, and my recession indicator has officially given the signal, showing that the economy is now firmly in the beginning stages of a recession. As, I've stated over the past few weeks, this signal was inevitable, especially when it became clear that the economy was grinding to a standstill.
So, while the coronavirus is a black swan event that has cast the global economy into a now confirmed recession, we have to keep in mind that there is an extraordinarily dangerous element that could make matters exponentially worse — the global debt crisis.
I've been sounding the alarm over and over of how dangerously unsustainable the debt crisis is, and that there is a relatively high chance that it would be born of the next major recession. For those that follow me, you know that I've talked at length about how we've already seen signs of the Fed losing interest rates here in the US, particularly in the overnight repo market, when rates spiked in minutes, from approximately 2% to 10%, despite the fact that the Fed had set the benchmark rate at 2.25%.
That happened because banks who actually had reserves, realized that far too many banks were scrambling to fill their reserves with loans in the overnight repo market. It was a huge red flag in the banking industry, and the banks that actually had reserves to lend in the repo market, would still do so, buuuuut at a 10% overnight rate as opposed to the Fed's set 2% rate. In a matter of minutes, rates exploded five fold. That could easily happen again, and in other areas of the economy, causing rates to explode out of control. In the case of the overnight repo market, the US Federal Reserve quickly jumped in, pumping some $800 billion into the repo market over the course of only a few days. Now, the Fed is basically doing the same thing, as it announced a few days ago that it inject up to $1.5 trillion into credit markets.
LET'S NOT FORGET, this is all on the back of the greatest stimulus the world has ever seen. During the course of quantitative easing (QE1, QE2, and QE3) the fed injected more than $5 trillion into the economy, the the form of bad mortgage backed security buybacks, and bond purchases. They were literally buying up toxic assets, in an attempt to manipulate the economy, and it has worked well, until now.
Now, we can see that the economy literally NEEDS continuous stimulus to survive. Despite enormous gains and "big growth" in the economy, it has all been smoke and mirrors, created by trillions and trillions of dollars of money printed by the Fed. Let's ask ourselves. When did the need to bailout the overnight repo market arise? It came after the Fed had been ever so slowly rising interest rates, in an attempt to return to a more "normalized" policy. However, they quickly reversed course, and here we are now back at a zero percent interest rate.
Here is why that is EXTRAORDINARILY DANGEROUS. It reduces the Fed's ability to react. In order to suppress rates, the Fed will usually buy bonds and drive up prices, which in turn pushes rates down. Remember, bond prices and interest rates have an inverse relationship. However, when rates are at zero, there isn't much room to push rates any lower, which is why it seems very likely that we will experience negative rates at some point before the debt crisis produces the greatest financial meltdown the world has ever seen.
It's not only the US Federal Reserve bank either. Most of the other reserve banks around the world are running at (or near) zero percent interest rates, following in lockstep with the US Fed. Japan, for example, has even taken rates negative. Well how "negative" can rates go?
As I stated above, global Federal Reserve banks generally control economic interest rates and the monetary supply. But with their rates at zero, and literally hundreds of trillions (possibly more than half a quadrillion dollars when you include all global unfunded liabilities) the ability of the global reserve banks to rescue the economy is severely diminished. They can't suppress rates much more than zero, so that's out. And they can't continue to reasonably print and print and print, without creating enormous amounts of inflation.
So, I think the economy is teetering on an extremely dangerous ledge, and all it would take, to create the worlds greatest financial collapse, would be the loss of interest rate control. We all know that corporate debt is dangerously levered right now, and that alone could cause massive problems in the US, not to mention the explosion of sub-prime lending that has occurred in the auto industry, or the constant depletion of US bank reserves.
I'll leave you with this. In the US, banks run on a system known as "fractional reserve banking." That means they literally only keep 10% of the depositors money in their accounts. The other 90% gets lent out. Oh yeah, and they don't even pay you any interest, or so much as send you a thank you letter, for lending out 90% of your money. So, lets see. The banks lend out 90% of the depositors money, and they have obviously have constantly depleting reserves, as evidenced by the overnight repo market's interest rate explosion and the Federal Reserve's intervention. So, if they lent out 90% of our money, and they have nothing in reserves, then where is the other 90% of our money? IT'S GONE! And, it's probably not coming back, because there is no escape plan to unwind the debt. It is unsustainable to run a fractional reserve banking system, in a debt based economic system. We are living in a house of cards. They have held it up and manipulated it for as long as they possibly could, but the market ALWAYS finds fair market value. Fair market value in THIS system, is massively lower.
I'm The Master of The Charts, The Professor, The Legend, The King, and I go by the name of Magic! Au revoir.
***This information is not a recommendation to buy or sell. It is to be used for educational purposes only.***
-JD-
This is the analysis referenced above, from August of 2019:

My Recession Indicator So Close To Signaling, Looks Inevitable!With the coronavirus slowing down global economies, and now oil collapsing with treasury yields, there is an increasing chance that we could be entering a recession. This is my recession indicator. If you're a long time follower of mine, you're probably familiar with this chart. Here is the breakdown...
The pink line graph on the chart is the S&P500 , and I'm comparing that to two key moving averages on the Initial Claims chart. Each time there has been a clear crossover (with orange crossing above purple AFTER a consistent downtrend) it has corresponded to a top in the S&P before a recession. This happened in the year 2000 right before the dot com bubble, and then it happened again in 2007 at the exact top before the great recession. You can see that with the vertical dashed red trendlines .
This indicator also works for finding the END of a recession. You can see that the first crossover with orange crossing below purple has been the signal that previous recessions have ended. You can see that with the two vertical green dashed trendlines. The crossover signaling the end of the great recession was a bit delayed, but it would have proven to be an extremely powerful entry indicator over time.
Currently, we can see that the moving averages are right on top of each other, and while they haven't crossed yet, it looks inevitable at this point. We still need to actually see the crossover to confirm it, but we should get the recession signal in the next week. We can see that there was a major peak in the S&P 500 chart, and that seems to be corresponding to the beginning of a recession. I will keep you all posted on the development of this indicator.
I'm The Master of The Charts, The Professor, The Legend, The King, and I go by the name of Magic! Au revoir.
***This information is not a recommendation to buy or sell. It is to be used for educational purposes only.***
-JD-
