The Bubble Many Traders Missed: Money Supply Up, Velocity Down**Most traders see rising money supply (M2) and assume asset prices will soar.**
But they ignore the **Velocity of Money (M2V)**—and that’s where the real danger is hiding.
---
## **The Great Disconnect**
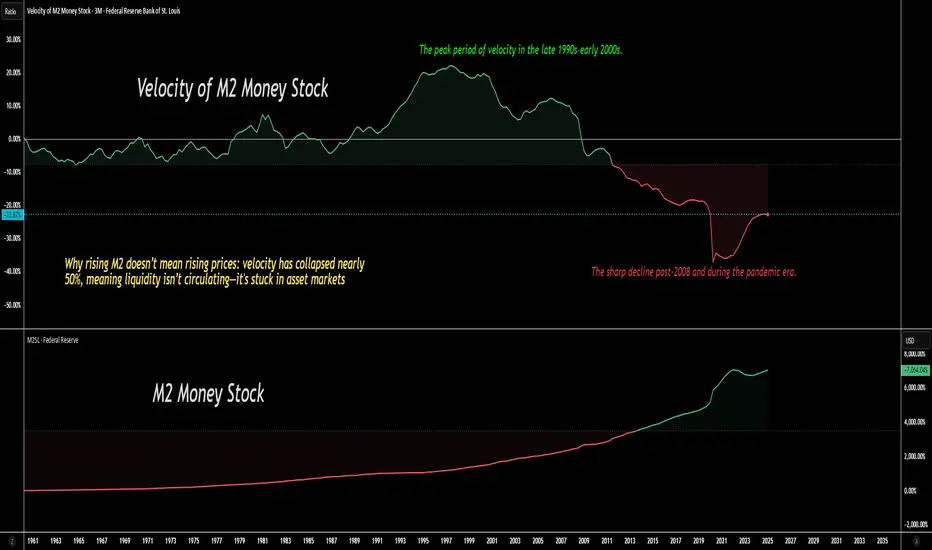
* **Money Supply (M2):** Central banks have flooded markets with liquidity since 2008 and a
About Velocity of M2 Money Stock
Related indicators
M2 Velocity
GDP to Money Supply (M2) has seen a sharp and persistent decline in turnover.
The number of times one dollar is used to purchase final goods and services which
are included in GDP.
GDP in Real Terms is deeply Negative, this is what the chart above indicates.
This simply confirms the Reverse Rep

M2 VelocityA conundrum?
No, absolutely not.
2022 it will reverse as scarcity becomes undeniable.
____________________________________________
Why are we losing Jobs in the Retail Economy?
Why was Black Friday / Cyber Monday dismal?
_____________________________________________
Herding Cats - if you'

M2 VelocityM2 consists of small-denomination time deposits >$100K - less IRA and Keogh balances at Institutions.
Balances in retail MMFs - less IRA and Keogh balances at MMFs.
M2: Savings Deposits, Small-Denomination Time Deposits, Retail Money Market Funds, + M1.
____________________________________
In

M2 VelocityThe squeeze is on, as M@V declines, there will be a Point of Recognition
when the average consumer sees Food Prices as a RISK.
At that time in the not too distant future, they will begin to spend and hoard
forward.
We are approaching the point at which on a percentage basis - this has occurred
His

M2 VelocityThe Patient is DOA.
Flatlined...
No Coma, only TOMO POMO YCC SEC LND...
The FED has your back.
Buy STONKS.

M2 - Velocity and Explanation of DIVERGENT TRENDS Explained V.1The explanation will be broken into several parts below:
You see what I see. M1/M2 Velocity collapsing while Fiscal Policies become far more
extreme in nature.
Profile and Structure are comprised of a great many observable metrics.
Volumes are wafer thin. Gamma squeezes are, on balance, failing.


BTCUSD chart is uselessDenominating in USD is pointless. We are still not even above the all time high from 2017 in terms of amount of money in the stocks + fed balance sheet. There will be a reckoning.

Bitcoin vs Money, Hyperinflation Hier zie je de DXY , de Velocity vs de Money Supply tegen de Bitcoin koers in een chart.
Hyperinflatie indicator? Wanneer de omloop snelheid weer toeneemt?
De blauwe lijn is de Velocity of Money de omloop, M2Ve.
De rode lijn is de Money Stock Total Money Supply for United States.
Goud gele chart.

See all ideas