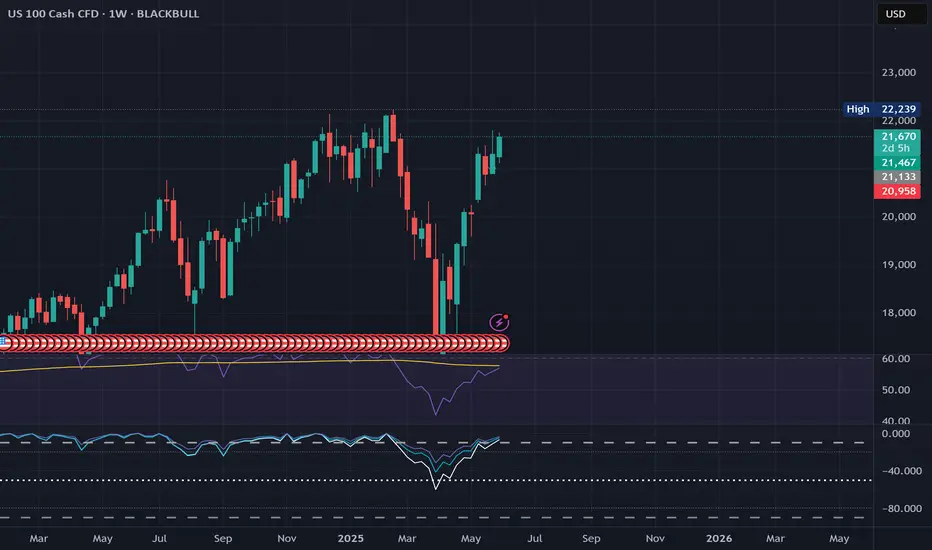
NASDAQ at Weekly Supply Zone – Bearish Breakdown Ahead? (READ)By examining the #Nasdaq chart on the weekly timeframe, we can see that the price is currently trading within the supply zone around 21,400. If it manages to close and stabilize below 21,100, we can expect further downside for this index. The potential bearish targets are 21,000, 20,700, 20,200, and 19,150. The key supply zone ranges from 21,400 to 22,200.
Please support me with your likes and comments to motivate me to share more analysis with you and share your opinion about the possible trend of this chart with me !
Best Regards , Arman Shaban
NDQ100 trade ideas

Bearish Three DivesBearish pattern hit on the 15 minute. Expecting a drop to 21k. Still bullish on the larger timeframes

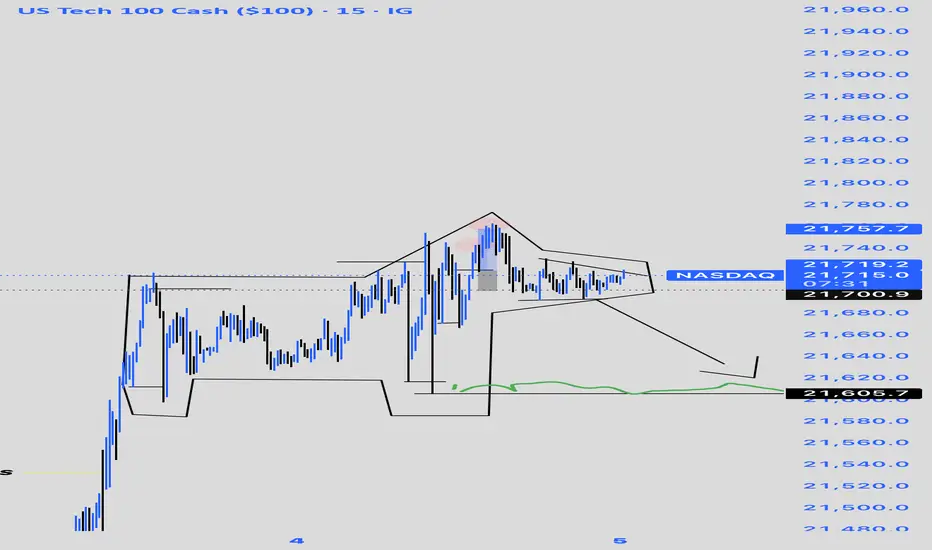
Why the Dinosaur Wants to Eat GrassHistorically, when price consolidates into a triangle (like the dino’s head here), it often signals compression before a significant move. In this case, the consolidation sits just below a key supply zone (21,750 area), forming a potential distribution top.
But why is our dinosaur looking to munch on that green grass down below (support around 21,605)?
• Similar formations during periods of exhaustion or after rapid rallies often result in sharp corrections.
• The green grass represents liquidity pools and prior demand where big players could reload.
• Note the sharp impulse up (the dinosaur’s neck) followed by a lack of momentum — a classic sign of weakening bulls.
So, just like in nature, when the top gets too dry and competitive, the dino (price) has to drop down to graze on safer, more nourishing grounds the unfilled orders lying at support
* NOT FINANCIAL ADVISE*
ALL GENERAL MARKETS at our close to May16 ExpirationsSeems Market makers have set up their Options to profit from a flat MARKET
Thoughts : ( Please comment you can just type in your number 1 or 2 )
1) Are the Market being held back from rallying higher ?
or
2) Are the Market being held back from Correcting deeper ?

Hedge funds are unusually bearish and here's why...We have a huge dealing range to short into and still remain bullish, it's basically free money on technical retracement/correction while not ruining the market.
The retailers have been buying since April but there is no institutional orderflow evidenced by no peak above average volume levels.
Technicals will reign supreme here. Trump is either trolling about the rate decrease or he has no idea about chart technicals 😮💨. I bet he's trolling, as he has cabinets on cabinets of market advisors who know fully how correction cycles work.

Nasdaq-100 H1 | Falling toward a pullback supportThe Nasdaq-100 (NAS100) is falling towards a pullback support and could potentially bounce off this level to climb higher.
Buy entry is at 21,516.72 which is a pullback support that aligns close to the 38.2% Fibonacci retracement.
Stop loss is at 21,340.00 which is a level that lies underneath an overlap support and the 50.0% Fibonacci retracement.
Take profit is at 21,803.01 which is a swing-high resistance.
High Risk Investment Warning
Trading Forex/CFDs on margin carries a high level of risk and may not be suitable for all investors. Leverage can work against you.
Stratos Markets Limited (tradu.com ):
CFDs are complex instruments and come with a high risk of losing money rapidly due to leverage. 63% of retail investor accounts lose money when trading CFDs with this provider. You should consider whether you understand how CFDs work and whether you can afford to take the high risk of losing your money.
Stratos Europe Ltd (tradu.com ):
CFDs are complex instruments and come with a high risk of losing money rapidly due to leverage. 63% of retail investor accounts lose money when trading CFDs with this provider. You should consider whether you understand how CFDs work and whether you can afford to take the high risk of losing your money.
Stratos Global LLC (tradu.com ):
Losses can exceed deposits.
Please be advised that the information presented on TradingView is provided to Tradu (‘Company’, ‘we’) by a third-party provider (‘TFA Global Pte Ltd’). Please be reminded that you are solely responsible for the trading decisions on your account. There is a very high degree of risk involved in trading. Any information and/or content is intended entirely for research, educational and informational purposes only and does not constitute investment or consultation advice or investment strategy. The information is not tailored to the investment needs of any specific person and therefore does not involve a consideration of any of the investment objectives, financial situation or needs of any viewer that may receive it. Kindly also note that past performance is not a reliable indicator of future results. Actual results may differ materially from those anticipated in forward-looking or past performance statements. We assume no liability as to the accuracy or completeness of any of the information and/or content provided herein and the Company cannot be held responsible for any omission, mistake nor for any loss or damage including without limitation to any loss of profit which may arise from reliance on any information supplied by TFA Global Pte Ltd.
The speaker(s) is neither an employee, agent nor representative of Tradu and is therefore acting independently. The opinions given are their own, constitute general market commentary, and do not constitute the opinion or advice of Tradu or any form of personal or investment advice. Tradu neither endorses nor guarantees offerings of third-party speakers, nor is Tradu responsible for the content, veracity or opinions of third-party speakers, presenters or participants.

Nasdaq 100 - Bearish Elliott Wave CountThe Nasdaq 100 (NDQ) has a completed extended Elliott five wave Impulse pattern from the 04/07/25 bottom.
Three - hour Stochastic is in the overbought zone and on the verge of a bearish cross.
RSI and MACD have bearish divergences.
A break below the rising trendline could be an important sell signal.

Nas100 1. Determine the Higher Timeframe Bias
Look at Daily & 4H charts.
Identify: Is market forming higher highs/lows (bullish) or lower highs/lows (bearish)?
2. Mark Liquidity Pools
Find equal highs/lows – where smart money will draw price to.
These often act as targets.
3. Find Displacement & Fair Value Gaps
If price made a strong move away from a level (displacement), look for a FVG on 1H/4H/Daily to see if price might retrace before continuing.
4. Use Premium/Discount Tool
From the recent swing high to low (or vice versa), divide the range.
Price in discount = buy zone; in premium = sell zone.
5. Mark Key Session Times
Focus on New York Open (8:30–11:00 am EST) – high-probability moves.

Nasdaq - The final bullrun breakout!Nasdaq - TVC:NDQ - might break above all structure:
(click chart above to see the in depth analysis👆🏻)
It is quite incredible how volatile stocks have been lately, especially considering that fact that the Nasdaq is about to create new all time highs again. Consequently, we are about to witness a significant structure breakout, which would ultimately lead to another rally of about +30%.
Levels to watch: $21.000
Keep your long term vision!
Philip (BasicTrading)

Hanzo / Nas100 15 Min Path ( Tactical Break Out Zones )🔥 Nas100 – 15 Min Scalping Analysis (Bearish Setup)
Bias: Waiting For Break Out
Time Frame: 15 Min
Entry Type: Confirmed Entry After Break Out
👌Bullish After Break : 21740
Price must break liquidity with high volume to confirm the move.
👌Bearish After Break : 21590
Price must break liquidity with high volume to confirm the move.
☄️ Hanzo Protocol: Dual-Direction Entry Intel
➕ Zone Activated: Strategic Reaction from Refined Liquidity Layer
Marked volatility from a high-precision supply/demand zone. System detects potential for both long and short operations.
🩸 Momentum Signature Detected:
Displacement candle confirms directional intent — AI pattern scan active.
— If upward: Bullish momentum burst.
— If downward: Aggressive bearish rejection.

Beautiful Market Maker on the Nasdaq this early morning.This will be an entire move downward that no one is picking up on right now. With price in the perfect sell position, we're looking to collect on the spread between greed and far like a true market maker
SELL NAS 100! TRADE WHAT YOU SEE NOT WHAT YOU FEELSell confirmations on 1 HR TF
1. Fair Value Gap retracement
2. Double top aligned with Fair Value Gap
3. If TL broken, another confirmation of a sell.
Basic trading, no stress, no complications - trade what you see and not what you feel.
Take Profit level - I am holding until Friday, but you can take profit if the money makes you smile.

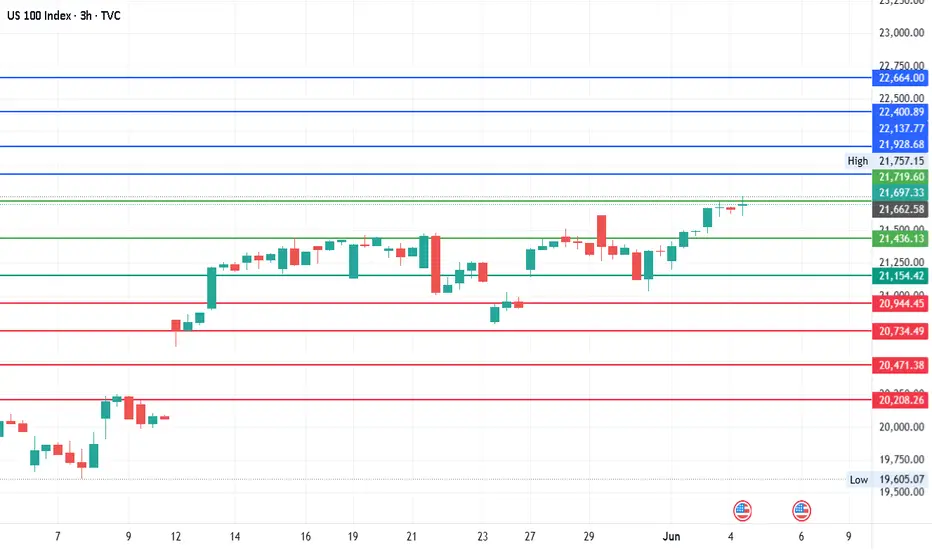
#NDQ - Pivot Point: 21,436.13Date: 30-05-2025
#NDQ Pivot Point: 21436.13 Support: 21154.42 Resistance: 21719.60
Upside Targets
Target 1: 21928.68
Target 2: 22137.77
Target 3: 22400.89
Target 4: 22664.00
Downside Targets:
Target 1: 20944.45
Target 2: 20734.49
Target 3: 20471.375
Target 4: 20208.26
SELLING NAS100 TODAY!Sell confirmations on 1 HR TF
1. Fair Value Gap retracement
2. Double top aligned with Fair Value Gap
3. If TL broken, another confirmation of a sell.
Basic trading, no stress, no complications - trade what you see and not what you feel.
Take Profit level - I am holding until Friday, but you can take profit if the money makes you smile.

"NASDAQ 100: THE TECH ROBBERY! – Quick Profits Before Reversal?"🔥 "The NDX NASDAQ 100 INDEX Heist: Bullish Loot & Escape Before the Trap!" 🔥
🌟 Hi! Hola! Ola! Bonjour! Hallo! Marhaba! 🌟
Dear Money Makers & Market Robbers, 🤑💰💸✈️
Based on the 🔥Thief Trading Style🔥 (technical + fundamental analysis), here’s our master plan to heist the NDX - NASDAQ 100 INDEX. Follow the strategy on the chart—long entry is the play! Aim to escape near the high-risk RED Zone (overbought, consolidation, potential reversal). The bears are lurking, so take profits and treat yourself—you’ve earned it! 💪🏆🎉
🚀Entry (The Vault is Open!)
"Swipe the bullish loot at any price!"
For precision, place buy limit orders within 15-30min timeframe (recent swing lows/highs).
Set alerts! Don’t miss the heist.
🛑 Stop Loss (Safety Net)
Thief-style SL at nearest swing low (4H timeframe) → 21,000.00 (adjust based on risk/lot size).
🏴☠️ Target 🎯: 22,800.00
Bullish momentum is fueling this heist—ride the wave but exit before the trap!
📰 Fundamental Backing (Why This Heist Works)
Macroeconomic trends, COT data, geopolitics, and sentiment align for bullish moves.
Full analysis? Check our bio0 linkk! 👉🔗🌎
⚠️ Trading Alerts (News & Risk Mgmt)
Avoid new trades during high-impact news (volatility = danger).
Use trailing stops to lock profits and dodge sudden reversals.
💥 Boost This Heist!
Hit 👍 (Boost Button) to strengthen our robbery squad!
More heists = More profits—stay tuned for the next steal! 🚀🤑
See you soon, fellow thieves! 🤝🎉


NAS and Oil Down - Minimal DrawdownQuick thoughts and reasons for trades taken with almost zero drawdown
Nas Short/Oil Short Trades

NASDAQ INDEX (US100): More Growth Ahead
For some unknown reason, I was asked by a dozen
of my subscribers to provide the update for US100.
Since early May, the index successfully updates the highs on a daily.
Such a tendency will remain at least till a test of a current ATH.
I think that the market is going to grow and reach at least 22100 level soon.
❤️Please, support my work with like, thank you!❤️

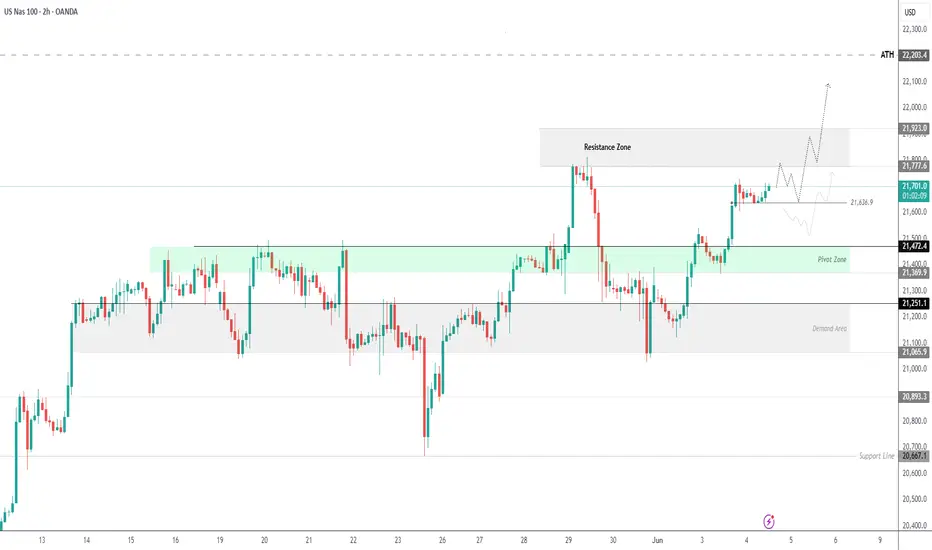
USNAS100 – Bullish Scenario Valid Above 21640, Targeting 21920USNAS100 | Technical Analysis
The price initiated a bullish trend after breaking above 21470, as previously mentioned. It is now continuing toward the target at 21770.
Currently, price is approaching the resistance at 21775.
If it fails to break above and stabilizes below 21775, we may see a consolidation within the range of 21775–21640.
🔺 A 1H close above 21775 may trigger a continued bullish move toward 21920 and 22100.
🔻 A 1H close below 21640 could lead to a correction down to 21475.
Resistance: 21775, 21920, 22100
Support: 21640, 21510, 21370
NSDQ100 INTRADAY ahead of ADP Jobs andd PMI dataToday’s key focus is on U.S. jobs and services data, and the Fed’s tone.
Markets will react to signs of inflation, growth and the Feds speech which could indicate a shift in direction of its core policy.
Key Support and Resistance Levels
Resistance Level 1: 22040
Resistance Level 2: 22250
Resistance Level 3: 22690
Support Level 1: 22330
Support Level 2: 22010
Support Level 3: 20780
This communication is for informational purposes only and should not be viewed as any form of recommendation as to a particular course of action or as investment advice. It is not intended as an offer or solicitation for the purchase or sale of any financial instrument or as an official confirmation of any transaction. Opinions, estimates and assumptions expressed herein are made as of the date of this communication and are subject to change without notice. This communication has been prepared based upon information, including market prices, data and other information, believed to be reliable; however, Trade Nation does not warrant its completeness or accuracy. All market prices and market data contained in or attached to this communication are indicative and subject to change without notice.

Hanzo / Nas100 15 Min Path ( Tactical Break Out Zones )🔥 Nas100 – 15 Min Scalping Analysis (Bearish Setup)
Bias: Waiting For Break Out
Time Frame: 15 Min
Entry Type: Confirmed Entry After Break Out
👌Bullish After Break : 21740
Price must break liquidity with high volume to confirm the move.
👌Bearish After Break : 21675
Price must break liquidity with high volume to confirm the move.
☄️ Hanzo Protocol: Dual-Direction Entry Intel
➕ Zone Activated: Strategic Reaction from Refined Liquidity Layer
Marked volatility from a high-precision supply/demand zone. System detects potential for both long and short operations.
🩸 Momentum Signature Detected:
Displacement candle confirms directional intent — AI pattern scan active.
— If upward: Bullish momentum burst.
— If downward: Aggressive bearish rejection.

Bears still are hereWhen we were talking about the negative financial consequences of tariffs and protectionism, the markets were declining — you can check our previous forecasts, we were right.
After that, the markets started to recover from the bear market — it's unclear why, since volatility and Trump’s reckless policies persist.
The coming years, we’re all going to be spending time with the bears. "Buy the dip" and "buy and hold" strategies are, to put it mildly, not the best options this year or next.
Get ready for the next recession.

Can Tech Strength Still Drive Markets Amid Trade Tensions?Macro approach:
The Nasdaq 100 (USTEC) began Jun with strong momentum after its best monthly performance since 2023, fueled by robust tech earnings and a brief lull in tariff concerns.
- However, renewed US-China trade tensions resurfaced early in the week, briefly weighing on sentiment before a market rebound restored cautious optimism.
- Nvidia (NVDA) surged due to the continued demand for AI chips. At the same time, Tesla (TSLA) drew investor focus ahead of its 12 Jun robotaxi launch, helping maintain positive momentum in the face of geopolitical uncertainty.
Technical approach:
- USTEC is now testing the previous swing high near 218000, staying above both EMAs, a sign of ongoing bullish strength.
- A clear break above 21800 would likely open the path toward the record-high zone near 22200.
- Failure to do so may trigger a pullback toward the nearest support of around 20700.
Analysis by: Dat Tong, Senior Financial Markets Strategist at Exness
