LONG NASDAQ50% Monthly candle breakout
50% Weekly ob
50% Candle weekly
Fibonacci retracement to golden ratio 61.8 TO 79%
Break out of a London high .
NDQ100 trade ideas

NAS100 SHORTElite Strategy.
Price at structured liquidity.
Targeting lower liquidity pools, lower structured liquidity zone.
Executed off the 10 minute time frame.

US100 Will Go Down!
HI,Traders !
#US100 made a retest
Of the wide horizontal
Resistance around 22688.6
And we are already seeing a
Local bearish reaction so
We will be expecting a
Further bearish move down !
Comment and subscribe to help us grow !

NASDAQ: Almost overbought but with no stop on this uptrend.Nasdaq is about to turn overbought on its 1D technical outlook (RSI = 68.420, MACD = 402.410, ADX = 22.800) but the current bullish wave shows no signs of stopping yet. The Channel Up since the April bottom indicates that a +9.50% rise is very likely before the next technical pullback, especially as long as the 1D MA50 is holding. Stay long, TP = 23,400.
## If you like our free content follow our profile to get more daily ideas. ##
## Comments and likes are greatly appreciated. ##


US100 update market The chart you've shared is a 2-hour timeframe for the US 100 index (NASDAQ 100) with a clear bearish outlook marked by projected price levels and potential demand zones.
Key Observations:
1. Current Price:
22,478.5 (near-term consolidation with recent bearish pressure)
2. Highlighted Zones:
Resistance Zone: Around 22,750–22,800 — where price previously reversed.
First Demand Zone: Around 22,100–22,200 — potential support.
Second Demand Zone: Around 21,500–21,600 — deeper support level.
Third Major Demand Zone: Near 21,200 — long-term support.
3. Bearish Structure:
Price has broken below recent support levels.
Black dotted line shows a projected move toward lower demand zones.
Momentum appears to be weakening after a strong bullish rally from June 21–28.
4. Technical Bias:
This is a bearish correction or possible trend reversal setup.
The presence of strong demand zones suggests potential bounce zones if price reaches those levels.
---
Summary:
This chart implies a bearish move is underway on the US 100 with expected targets near 22,100, then 21,600, and potentially 21,200. Watch for bullish reaction or reversal signals at those zones. If price reclaims 22,800+, bearish outlook would be invalidated.
Let me know if you want a trade setup or confirmation strategy based on this analysis.

Tesla Drop Pressures Nasdaq – 22,470 Key to Hold RecoveryUSNAS100 | Overview
Tesla dropped approximately 5%, weighing heavily on the Nasdaq, amid public tensions between Elon Musk and Donald Trump.
Yesterday, the price declined below 22,610 due to the impact of Tesla’s fall but remained above 22,470. As long as it trades above this level, a recovery attempt is likely, with the price expected to break through the consolidation zone between 22,615 and 22,740.
However, if the 1h candle closes below 22,470, the bearish trend is expected to continue toward 22,280 and potentially lower.
Pivot: 22,470
Resistance: 22,615 – 22,740 –23,000
Support: 22,280 – 22,200

Weekly highs swept, aiming for weekly lows now.Liquidity Grab above Weekly Highs
Bearish Rejection Wicks
Trendline Break
Imbalance / Fair Value Gaps below
Reversion to Mean / Higher Timeframe Discount Zones

USNAS100 Bullish Momentum Holds Above Key PivotUSNAS100 – Overview
The price successfully retested the 22,610 level and resumed its bullish trend, reaching 22,750 as anticipated in our previous idea.
Currently, the index needs to maintain stability above the 22,610 pivot line to sustain the upward momentum toward the next resistance at 22,790. A sustained move above this level may open the path toward 23,000.
However, a 1H candle close below 22,610 could trigger a corrective move down to 22,480. A break below this support would expose the next key level at 22,280.
Pivot: 22,610
Resistance: 22,790 – 23,000
Support: 22,480 – 22,280

NASDAQNASDAQ If the price cannot break through the 22728 level, it is expected that the price will drop. Consider selling the red zone.
🔥Trading futures, forex, CFDs and stocks carries a risk of loss.
Please consider carefully whether such trading is suitable for you.
>>GooD Luck 😊
❤️ Like and subscribe to never miss a new idea!

Nasdaq-100 H4 | Bullish uptrend to extend higher?The Nasdaq-100 (NAS100) is falling towards a swing-low support and could potentially bounce off this level to climb higher.
Buy entry is at 22,509.40 which is a swing-low support that aligns closely with the 23.6% Fibonacci retracement.
Stop loss is at 22,150.00 which is a level that lies underneath an overlap support and the 38.2% Fibonacci retracement.
Take profit is at 23,264.68 which is a resistance that aligns with the 61.8% Fibonacci projection.
High Risk Investment Warning
Trading Forex/CFDs on margin carries a high level of risk and may not be suitable for all investors. Leverage can work against you.
Stratos Markets Limited (tradu.com ):
CFDs are complex instruments and come with a high risk of losing money rapidly due to leverage. 63% of retail investor accounts lose money when trading CFDs with this provider. You should consider whether you understand how CFDs work and whether you can afford to take the high risk of losing your money.
Stratos Europe Ltd (tradu.com ):
CFDs are complex instruments and come with a high risk of losing money rapidly due to leverage. 63% of retail investor accounts lose money when trading CFDs with this provider. You should consider whether you understand how CFDs work and whether you can afford to take the high risk of losing your money.
Stratos Global LLC (tradu.com ):
Losses can exceed deposits.
Please be advised that the information presented on TradingView is provided to Tradu (‘Company’, ‘we’) by a third-party provider (‘TFA Global Pte Ltd’). Please be reminded that you are solely responsible for the trading decisions on your account. There is a very high degree of risk involved in trading. Any information and/or content is intended entirely for research, educational and informational purposes only and does not constitute investment or consultation advice or investment strategy. The information is not tailored to the investment needs of any specific person and therefore does not involve a consideration of any of the investment objectives, financial situation or needs of any viewer that may receive it. Kindly also note that past performance is not a reliable indicator of future results. Actual results may differ materially from those anticipated in forward-looking or past performance statements. We assume no liability as to the accuracy or completeness of any of the information and/or content provided herein and the Company cannot be held responsible for any omission, mistake nor for any loss or damage including without limitation to any loss of profit which may arise from reliance on any information supplied by TFA Global Pte Ltd.
The speaker(s) is neither an employee, agent nor representative of Tradu and is therefore acting independently. The opinions given are their own, constitute general market commentary, and do not constitute the opinion or advice of Tradu or any form of personal or investment advice. Tradu neither endorses nor guarantees offerings of third-party speakers, nor is Tradu responsible for the content, veracity or opinions of third-party speakers, presenters or participants.

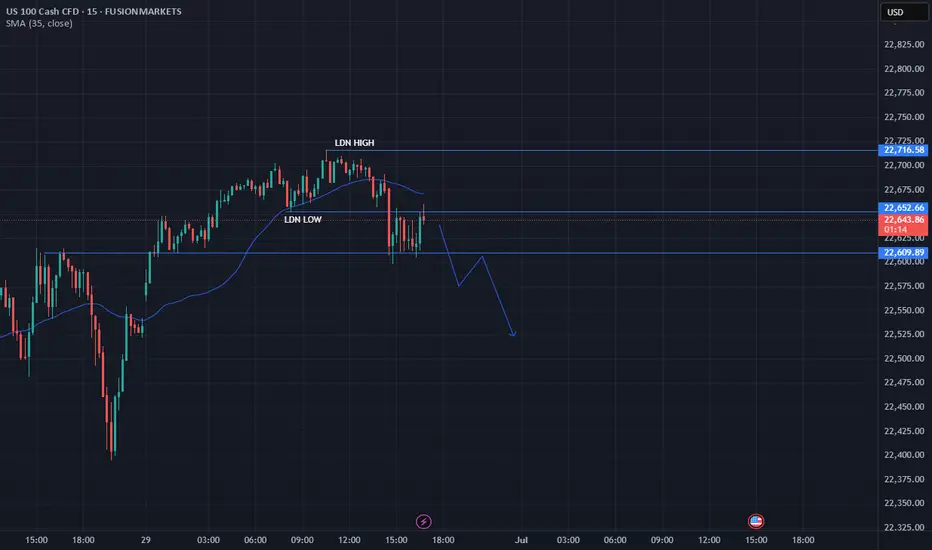
Bullish BiasMarked the LDN highs and lows, Waited for the sweep of sell side liquidity on LDN lows, waiting for BOS and CHoCH and FVG before we enter buys back to the SSL at the London highs.

Nasdaq shortI think it is time to take the lows on the lower time frame.
Time for a small reversal.
1min entry and bos .

USNAS100 |Bullish Trend Holds Above Pivot – Eyeing 22790 & 23000USNAS100 | Bullish Movement
The price has stabilized above the key pivot level at 22640, confirming a continuation of the bullish trend toward the next resistance at 22790.
As long as the index remains above 22640, the uptrend is expected to extend toward 22790 and potentially 23000, with minor pullbacks likely to retest the pivot.
Currently, USNAS100 is consolidating between 22640 and 22790.
A 1H candle close below 22640 would signal a bearish correction toward 22520 and possibly 22410.
Pivot Line: 22640
Resistance Levels: 22790, 23000
Support Levels: 22520, 22410
previous idea:

US100 POSSIBLE SELL OPPORTUNITY!!We’re going to see a possible sell opportunity on US100 from the current market price. SL 22594 take profit at 22178

NSDQ100 lower after ADP Employment shrank to 33K in JuneTrump Trade Tensions:
Donald Trump reaffirmed his July 9 deadline for higher tariffs, intensifying criticism of Japan, particularly over auto sector issues. While Japan insists talks are in good faith, market fears of a breakdown are rising.
US Tax Policy in Focus:
Trump’s “Big Beautiful” tax and spending bill faces potential resistance in the House despite narrowly passing the Senate. The proposal’s scale and political friction are drawing investor attention.
Apple Supply Chain Worry:
Foxconn has pulled hundreds of Chinese staff from its Indian iPhone factories, sparking fresh concerns about Apple’s supply chain and Wall Street’s potentially overheated tech optimism.
Paramount Settlement:
Paramount resolved a lawsuit with Trump over alleged election interference via CBS’s coverage. Meanwhile, the company awaits FCC approval for its Skydance merger.
Auto Sector Weakness:
Stellantis reported a 10% drop in U.S. Q2 deliveries despite some brand gains. Tesla is expected to post a 12% annual decline in vehicle deliveries, reinforcing signs of cooling demand in the sector.
Conclusion:
Markets remain cautious but resilient amid political tensions, supply chain disruptions, and weaker auto sales. Attention is now turning to upcoming trade deadlines, policy decisions, and Q2 corporate results.
Key Support and Resistance Levels
Resistance Level 1: 22710
Resistance Level 2: 22820
Resistance Level 3: 22930
Support Level 1: 22190
Support Level 2: 22040
Support Level 3: 21900
This communication is for informational purposes only and should not be viewed as any form of recommendation as to a particular course of action or as investment advice. It is not intended as an offer or solicitation for the purchase or sale of any financial instrument or as an official confirmation of any transaction. Opinions, estimates and assumptions expressed herein are made as of the date of this communication and are subject to change without notice. This communication has been prepared based upon information, including market prices, data and other information, believed to be reliable; however, Trade Nation does not warrant its completeness or accuracy. All market prices and market data contained in or attached to this communication are indicative and subject to change without notice.

NAS100 Potential ReversalHi there,
The NAS100 is slightly bullish and fairly stagnant. It is consolidating between two key levels (orange lines). A break below the price might fall into deeper demand zones.
Short Notes
- **Elliott Wave**: 5-wave structure appears complete at resistance (22,137.8), signalling a possible reversal.
- **Liquidity Zones**: Price is at/near a major liquidity zone, increasing reversal risk.
- **Break High**: There's a potential for a false breakout above wave 5 before dropping.
- **Support Levels**: The 21,800.6 (previous day high) and 21,146.2 (previous day low) for first support.
- **Demand Zones**: Strong demand below 21,146.2, with deeper support near 20,000 and 18,800.
- **Overview: A possible bearish move ahead from current highs, targeting lower demand zones.
Happy Trading,
K.
Not trading advice

US100Price broke daily resistance last week and now looks like a retracement is on the way. H4 gave a double top at the rising channel resistance. Pulling back to retest the neckline. target is 22,200.

US100 – Extended Rally, Eyes on Pullback to Key SupportUS100 continues to show impressive strength, with no real signs of slowing down yet. The recent push above the previous all-time high came with strong bullish candles and high volume, confirming the breakout as legitimate rather than a false pump. This surge followed a clean retest of the fair value gap below, which acted as a springboard for the next leg higher.
Imbalance Retest and ATH Break
Before the breakout, price perfectly respected the FVG just above the 20,800 zone. That retest was crucial, showing institutional interest in defending higher prices. From there, the index cleared the old ATH with authority, and we are now trading comfortably above it, establishing new highs in the process.
Support Zone Outlook
While momentum remains bullish, the market doesn’t move in a straight line forever. A short-term cool-off is possible. I’m eyeing the marked-out support zone just above 21,400, which previously acted as resistance and now flips to demand. If we do pull back, this is the most logical area for buyers to step back in.
Potential Price Path
The dotted projection outlines two possible paths: one, a minor pullback followed by immediate continuation, and two, a deeper retest into the green support zone before resuming the uptrend. Both scenarios remain bullish as long as price stays above that support. A retest into this level would be healthy and provide a clean long entry for continuation.
Key Levels to Watch
The area around 21,400 to 21,700 is critical. If we revisit this zone, I’ll be watching for bullish price action to confirm continuation. On the upside, we’re now in price discovery mode, so upside targets are more open-ended, but 23,000+ becomes a magnet if momentum stays intact.
Conclusion
US100 is in strong bullish territory, with institutional signs backing the move. A pullback would be welcome and likely provide a high-probability long setup. Until the structure breaks, I remain bullish on this index, watching for a healthy dip into the support zone for potential continuation higher.
Disclosure: I am part of Trade Nation's Influencer program and receive a monthly fee for using their TradingView charts in my analysis.
___________________________________
Thanks for your support!
If you found this idea helpful or learned something new, drop a like 👍 and leave a comment, I’d love to hear your thoughts! 🚀

Up Up Up... Nothing Can Stop NAS From RisingLet's take a look at the big picture in the NASDAQ: Do you see how nicely the spring crash landed on the 50% retracement of the upward movement since fall 2022?
Now that we've crossed the old ATH, the targets are clear, and they're way up in the NASDAQ.
The summer correction is therefore likely to fail and probably turn into a listless sideways slide. By September at the latest, however, the NAS should pick up speed again and head for targets between 25,000 and 26,000 - at the very least.
Clear skies!

Nas100With speculation about no rate cuts we can expect to see Nas100 plumet with Fed Powells upcoming speech.
If we look at the technical side we can see that Nas has been somewhat consolidating over the past 2 days creating a fair amount of Sell side liquidity. We can expect Powell to speak about rat cuts today in his upcoming speech and we will use this to our advantage waiting for early buyers to push up the market triggering our setup.
We can look for a plus minus 100 pip move before Nas turns around, we will however closely monitor the movement of Nas now until the speech so that we can execute a trade with the least amount of risk.
Remember to like and subscribe for more A+ setups.

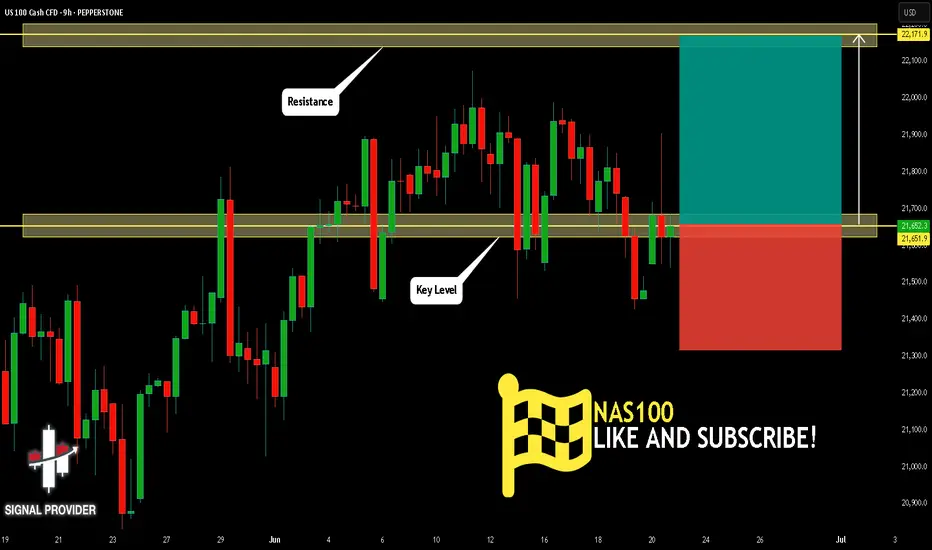
NAS100 Will Go Up From Support! Buy!
Please, check our technical outlook for NAS100.
Time Frame: 9h
Current Trend: Bullish
Sentiment: Oversold (based on 7-period RSI)
Forecast: Bullish
The market is approaching a key horizontal level 21,651.9.
Considering the today's price action, probabilities will be high to see a movement to 22,171.9.
P.S
We determine oversold/overbought condition with RSI indicator.
When it drops below 30 - the market is considered to be oversold.
When it bounces above 70 - the market is considered to be overbought.
Disclosure: I am part of Trade Nation's Influencer program and receive a monthly fee for using their TradingView charts in my analysis.
Like and subscribe and comment my ideas if you enjoy them!