NASDAQ TRADING RESULT – JUNE 13, 2025📉 NASDAQ TRADING RESULT – JUNE 13, 2025 📉
Following the analysis from June 9, 2025, NASDAQ has reached the bearish target at Magnet Area (DmH4) 21524.00 on June 13, 2025.
The move started with a rejection from Magnet Area (SpH4) 21767.00 – 22067.00. As long as price remains below 21767.00, there is still downside potential toward Magnet Area (DmH4) 21136.00.
⚠️ DISCLAIMER:
This content is for educational purposes only and not financial advice. Trading involves high risk. Always perform your own analysis and apply proper risk management.
NDQ100 trade ideas

USNAS100 | Bearish Below 21635 Amid Geopolitical UncertaintyUSNAS100 | OVERVIEW
The index is currently under bearish momentum driven by escalating geopolitical tensions.
As long as the situation remains unresolved, downward pressure is expected to continue.
Outlook:
As long as the price stays below the pivot at 21635, the index is likely to drop toward 21470.
A confirmed break below 21470 could accelerate the decline toward 21250, and eventually 21065.
Pivot Line: 21635
Support Levels: 21470, 21250, 21065
Resistance Levels: 21790, 21930, 22090

Lets retire on Trump bullmarketLets retire on Trump bullmarket, last time Trump delivered 120% Nasdaq gains over 4 years lets see history repeat itself!
Perfect buy point is now, block all bearish american pigs and retire now.

NSDQ100 uptrend consolidation supported at 21300Markets Rattled After Israel Strikes Iran
Israel launched major airstrikes on Iran, targeting nuclear and missile sites, as well as top military leaders. The move sharply escalates tensions in the Middle East and came despite warnings from former President Donald Trump, who was told of the attack only shortly beforehand. He later warned Iran that future strikes would be “even more brutal” if no deal is made.
Market Reaction:
Oil jumped up to 13% on fears of supply disruptions.
Gold climbed as investors rushed to safe-haven assets.
Stock futures and crypto fell on rising geopolitical risk.
The U.S. dollar dipped, then rebounded, as its role as a safe-haven asset came into focus.
Other Key Updates:
Trump wins court backing to keep troops in Los Angeles amid ongoing protests. A hearing is set for Tuesday.
Meta invests billions in Scale AI, bringing on its CEO to boost efforts in building artificial general intelligence. Meta is aggressively hiring top AI talent from firms like Google.
For Traders:
Watch oil and gold closely for continued volatility.
Safe-haven flows could drive further USD and gold moves.
Meta’s AI push may influence tech sector sentiment.
Key Support and Resistance Levels
Resistance Level 1: 22070
Resistance Level 2: 22370
Resistance Level 3: 22680
Support Level 1: 21300
Support Level 2: 21060
Support Level 3: 20820
This communication is for informational purposes only and should not be viewed as any form of recommendation as to a particular course of action or as investment advice. It is not intended as an offer or solicitation for the purchase or sale of any financial instrument or as an official confirmation of any transaction. Opinions, estimates and assumptions expressed herein are made as of the date of this communication and are subject to change without notice. This communication has been prepared based upon information, including market prices, data and other information, believed to be reliable; however, Trade Nation does not warrant its completeness or accuracy. All market prices and market data contained in or attached to this communication are indicative and subject to change without notice.

#NASDAQ (4H)"NASDAQ futures (4H) will dropped from 21,938.3 to 21,562.0 — one of the key indicators from the specified zone."
First Target Zone 19,245 To 18,842

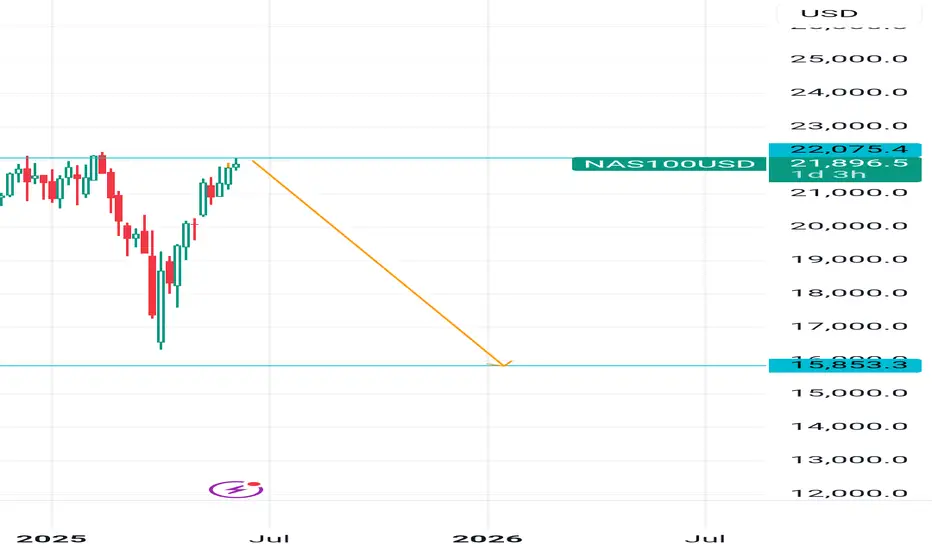
Bulls game over now 15853 incoming Short from 22000 Tp 15853.. Weekly TF big move down incoming.. Bulls Fasten your seatbelt please.. Good luck and safe trade
CHECK US100 SIGNAL READ CAPTAINus100 sell now ✅
entry point (21920) (21910)
TAKE PROFIT 1: (21860)
TAKE PROFIT 2: (21800)
LAST TARGET (21740)
STOP LOSS (21970)

NASDAQ Potential UpsidesHey Traders, in today's trading session we are monitoring NAS100 for a buying opportunity around 21,700 zone, NASDAQ is trading in an uptrend and currently is in a correction phase in which it is approaching the trend at 21,700 support and resistance area.
Trade safe, Joe.


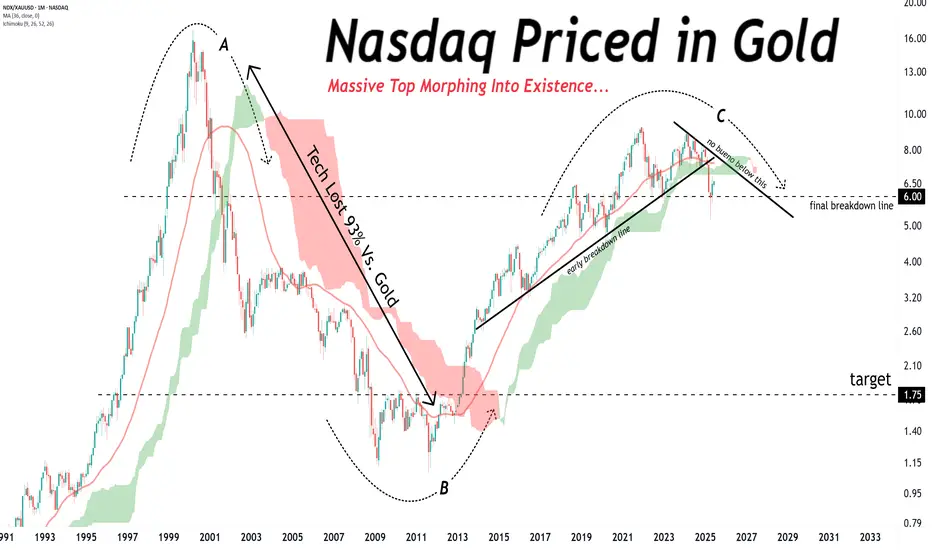
NASDAQ PRICED IN GOLD FORMING A MASSIVE TOP.NASDAQ PRICED IN GOLD FORMING A MASSIVE TOP.
If history rhymes… tech could bleed value while Gold continues to shine.
Final breakdown nearing, where you would expect the Nasdaq to fall as this gets confirmed.
long trade in NQ100 Simple analytics and quant analyticsDaily time frame we have area of accumulation .
4h TF realty market structure bullish .
30 TF we have multi area of resistance to support, Its mean
a signal of market next time go up .

Hanzo / Nas100 15 Min ( Accurate Tactical Bullish Break Out )🔥 Nas100 – 15 Min Scalping Analysis
⚡️ Objective: Precision Breakout Execution
Time Frame: 15-Minute Warfare
Entry Mode: Only after verified breakout — no emotion, no gamble.
👌Bullish After Break : 21920 / Break out done
Price must break liquidity with high volume to confirm the move.
☄️ Hanzo Protocol: Dual-Direction Entry Intel
➕ Zone Activated: Strategic liquidity layer detected — mapped through refined supply/demand mechanics. Volatility now rising. This isn’t noise — this is bait for the untrained. We're not them.

Nasdaq will reach 25'000 still no body see it?Current level: 21,876
Previous ATH: 22,222.61
Next stop? Well… if you ask the pivot levels they're whispering "23347.20, baby."
What we’re looking at is not just a strong recovery it’s a market that refuses to take a breather. With weekly candles forming higher lows and pivot zones behaving like polite suggestions rather than resistance, it’s hard not to think the index is gearing up for a proper breakout.
Sure, skeptics will say we’re overextended. Bears will point to the volume spikes and say “exhaustion.” But momentum? She's dancing in stilettos on top of R3 like it's a catwalk.
Now, here's the fun part:
If this rhythm keeps up and if inflation, rates, and the Fed behave like decent background characters then 25,000 by the end of the year isn’t just possible. It's that slightly overconfident friend at the party who's already halfway into a celebratory toast.
So… who dares to trust the trend?
Because let’s be honest: being early is painful, being late is expensive but being in the trend? That’s just good business.
📈 Trade safe, manage risk, and don’t fight the trend. Unless you're into that kind of thrill.
#tradehills #Pscarfo

Nasdaq at Supply Zone – Rejection or Breakout? (READ THE CAPTIONBy examining the #Nasdaq chart on the weekly timeframe, we can see that the price is still trading within the supply zone around 21,850. We are still waiting for a strong rejection from this level, which could lead to a short-term price correction in this index.
The potential downside targets are:
21,000, 20,700, 20,200, and 19,150.
The key supply range lies between 21,400 and 22,200.
Additionally, there is a possibility of a liquidity grab or stop-hunt above 22,200 before any real drop begins.
This analysis will be considered invalid if price closes above 22,400 in the next three weeks.
On the fundamental side, there are several macro factors to watch:
Interest Rate Expectations:
Although inflation in the U.S. has cooled compared to last year, the Fed remains cautious. If upcoming CPI or PPI prints show unexpected resilience, the likelihood of rate cuts this year could diminish, pressuring tech-heavy indices like Nasdaq.
Tech Sector Valuations:
Valuations in major tech names — such as NVIDIA, Apple, and Microsoft — have reached historically high multiples. This makes Nasdaq particularly vulnerable to correction, especially if earnings disappoint or growth expectations soften.
Geopolitical Risks:
Ongoing tensions between the U.S. and China over trade and technology, as well as potential instability in the Middle East, could contribute to a risk-off sentiment — further supporting the case for a short-term pullback.
Earnings Season Ahead:
Q2 earnings season is around the corner. Any signs of slowing revenue growth or reduced forward guidance from major tech firms could act as a catalyst for the expected correction.
Please support me with your likes and comments to motivate me to share more analysis with you and share your opinion about the possible trend of this chart with me !
Best Regards , Arman Shaban

SELL NAS100This is my analysis of NAS100. These are the sell confirmations:
1. Doble top
2. Double top aligned with Fair Value Gap
3. Currently retesting the neckline of the double top
4. The trendline has been touched 3 times and therefore it is a weak trendline. It will be broken.
5. Please do not follow my take profit positions - when your profits make you smile, close the trade.
Trade what you see and not what you feel!

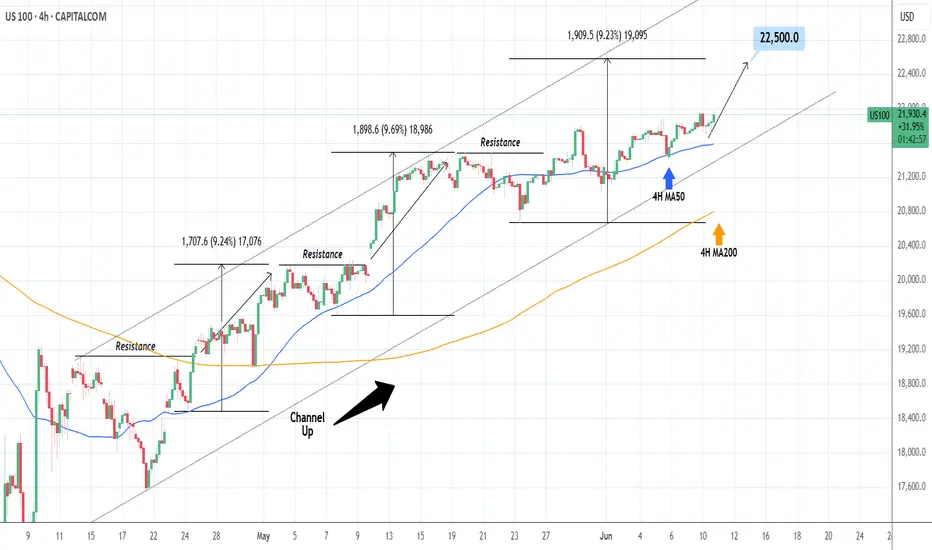
NASDAQ: Close to a strong bounce.Nasdaq is about to turn overbought on its 1D technical outlook (RSI = 68.736, MACD = 505.460, ADX = 18.046) as it is extending an uptrend since the 4H MA50 test/bounce. Such low paced price increase typically precedes strong breakouts. Since the long term pattern is a Channel Up, we are still on its 3rd bullish wave overall. The prior ones were +9.50% on avg, so we remain bullish on the short term, TP = 22,500.
## If you like our free content follow our profile to get more daily ideas. ##
## Comments and likes are greatly appreciated. ##
USTECPrevious analysis on May 30 found that the price came down to test the support level at 20,693 but could not break through. Now the price has returned to test the resistance level at 21,737-22,139 again. If the price cannot break through the level of 22,139, it is expected that the price will drop. Consider selling in the red zone.
🔥Trading futures, forex, CFDs and stocks carries a risk of loss.
Please consider carefully whether such trading is suitable for you.
>>GooD Luck 😊
❤️ Like and subscribe to never miss a new idea!

Nasdaq-100 H1 | Swing-low support at 61.8% Fibonacci retracementThe Nasdaq-100 (NAS100) is falling towards a swing-low support and could potentially bounce off this level to climb higher.
Buy entry is at 21,479.25 which is a swing-low support that aligns closely with the 61.8% Fibonacci retracement.
Stop loss is at 21,320.00 which is a level that lies underneath a pullback support.
Take profit is at 21,721.90 which is a pullback resistance that aligns with the 50% Fibonacci retracement.
High Risk Investment Warning
Trading Forex/CFDs on margin carries a high level of risk and may not be suitable for all investors. Leverage can work against you.
Stratos Markets Limited (tradu.com ):
CFDs are complex instruments and come with a high risk of losing money rapidly due to leverage. 63% of retail investor accounts lose money when trading CFDs with this provider. You should consider whether you understand how CFDs work and whether you can afford to take the high risk of losing your money.
Stratos Europe Ltd (tradu.com ):
CFDs are complex instruments and come with a high risk of losing money rapidly due to leverage. 63% of retail investor accounts lose money when trading CFDs with this provider. You should consider whether you understand how CFDs work and whether you can afford to take the high risk of losing your money.
Stratos Global LLC (tradu.com ):
Losses can exceed deposits.
Please be advised that the information presented on TradingView is provided to Tradu (‘Company’, ‘we’) by a third-party provider (‘TFA Global Pte Ltd’). Please be reminded that you are solely responsible for the trading decisions on your account. There is a very high degree of risk involved in trading. Any information and/or content is intended entirely for research, educational and informational purposes only and does not constitute investment or consultation advice or investment strategy. The information is not tailored to the investment needs of any specific person and therefore does not involve a consideration of any of the investment objectives, financial situation or needs of any viewer that may receive it. Kindly also note that past performance is not a reliable indicator of future results. Actual results may differ materially from those anticipated in forward-looking or past performance statements. We assume no liability as to the accuracy or completeness of any of the information and/or content provided herein and the Company cannot be held responsible for any omission, mistake nor for any loss or damage including without limitation to any loss of profit which may arise from reliance on any information supplied by TFA Global Pte Ltd.
The speaker(s) is neither an employee, agent nor representative of Tradu and is therefore acting independently. The opinions given are their own, constitute general market commentary, and do not constitute the opinion or advice of Tradu or any form of personal or investment advice. Tradu neither endorses nor guarantees offerings of third-party speakers, nor is Tradu responsible for the content, veracity or opinions of third-party speakers, presenters or participants.

NASDAQ ShortLooking for the short on Nasdaq been trading this long and short through out the week. Check the linked publications. Shouted out 22,000 before seeing the short.

USNAS100 | Breakout or Breakdown?USNAS100 | OVERVIEW
The price is currently stabilizing below the pivot level at 21790, suggesting continued bearish momentum.
📉 As long as the index remains below 21790, we expect a decline toward 21635. A confirmed 1H candle close below this level could extend the bearish trend toward 21470.
📈 A shift to bullish momentum will require a 1H candle close above 21820, which could open the way to 22090 and potentially a new all-time high at 22200.
Support Lines: 21635, 21470
Resistance Lines: 21930, 22090, 22200

NASDAQ break and retest: SHORTI found a good and solid breakout of a TL and its retesting now.
The retest is now on the broken TL, strong area of S/R and its fibo level..
We will see further drop in next week!!
CHEERRRSSS...!!!

NASDAQ The bearish bias is supported by the COT data showing the majority of non-commercial traders are increasing their short positions. Sell/Short: Consider entering a short position at current levels, with a stop above the resistance zone (preferably just above the recent swing high).

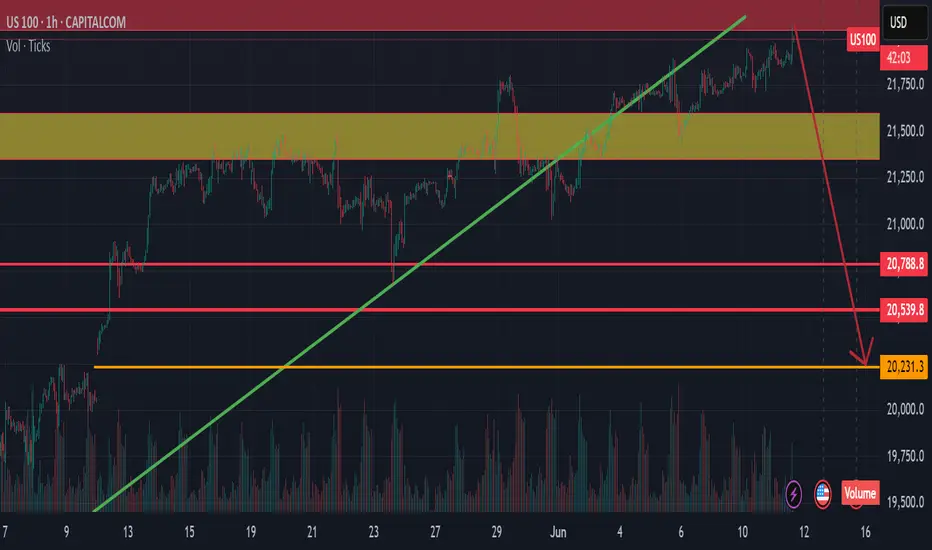
Sell NAS100 market resetSelloff has started at the 22000 zone
Should the GAP at 20231 zone fail to hold we will see more sellers coming in.
Hoping bears win this one.