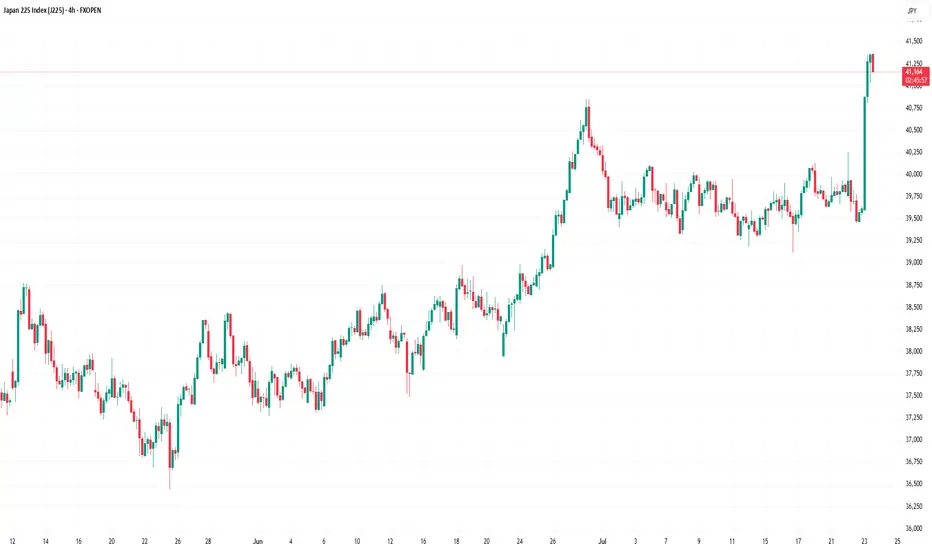
Nikkei 225 Index Surges Above 41,000 PointsNikkei 225 Index Surges Above 41,000 Points
As the chart indicates, the value of the Nikkei 225 stock index has risen above the 41,000-point level — its highest mark since July 2024.
The primary bullish driver is the conclusion of a trade agreement between the United States and Japan. According t
About Nikkei Stock Average, Nikkei 225
Related indicators
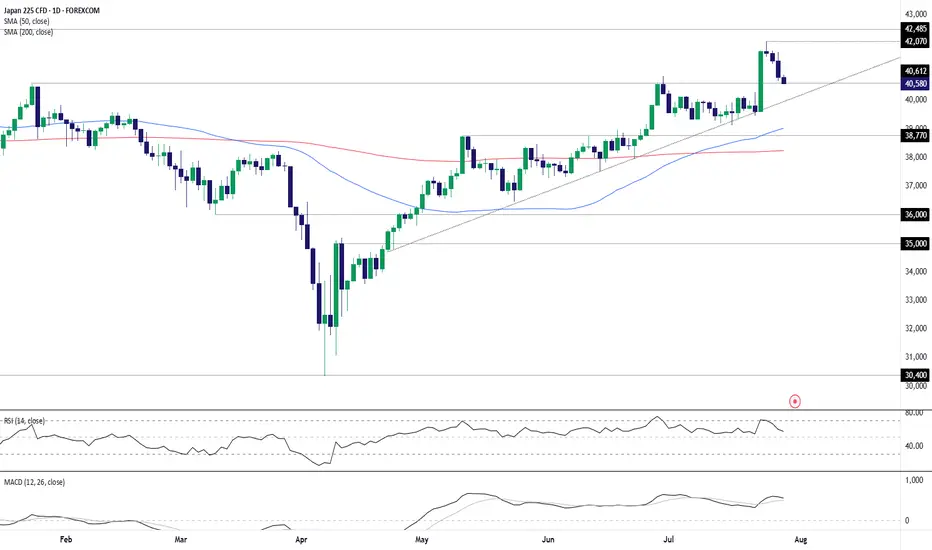
Japan 225 Unwind Pauses at Known SupportThe Japan 225 contract has spent the past three sessions partially unwinding the sharp rally sparked by Japan’s trade agreement with the United States last week, leaving price resting on a known support level. Near-term price action may determine whether bullish or bearish setups hold the upper hand
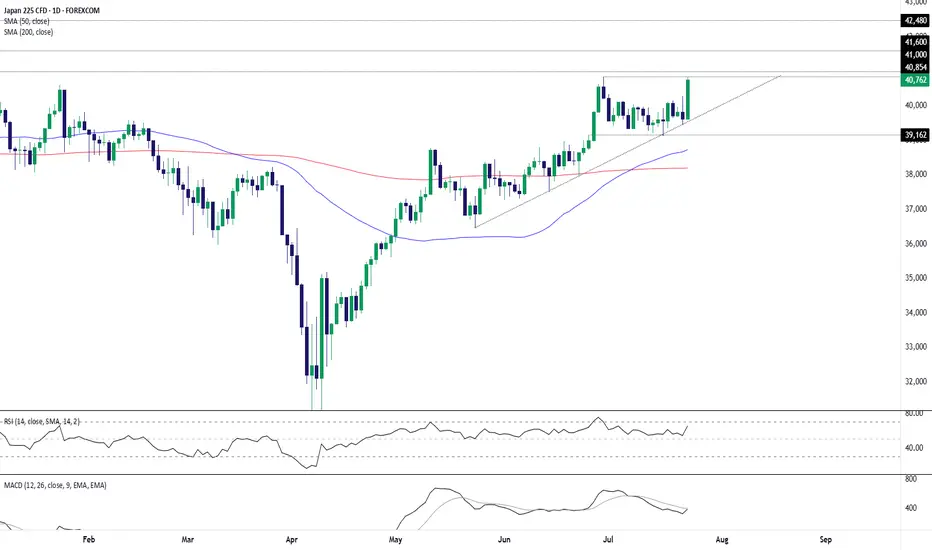
Japan 225: Breakout Watch as Tariff Cut Fuels RallyThe Japan 225 contract is ripping higher today on a trade deal being reached between the U.S. and Japan, including the apparent lowering of auto tariffs to 15%.
The price has already bounced strongly from uptrend support established in May, putting a potential retest of the June 30 high of 40854 on
NI225: Move Down Expected! Short!
My dear friends,
Today we will analyse NI225 together☺️
The recent price action suggests a shift in mid-term momentum. A break below the current local range around 41,456.23 will confirm the new direction downwards with the target being the next key level of 40,954.70 and a reconvened placement

Nikkei 225 Wave Analysis – 29 July 2025- Nikkei 225 reversed from the resistance zone
- Likely fall to support level 40000.00
Nikkei 225 index recently reversed from the resistance zone between the resistance levels 42000.00 (which started the sharp sell-off in 2024) and 41285.00.
This resistance zone was further strengthened by the up

JP225 Long Trap or Bull Escape? Heist in Motion.🦹♂️🎯 JP225 Ninja Heist: Breakout Loot Plan 💥💰 (Long Game Playbook)
🌟Hi! Hola! Ola! Bonjour! Hallo! Assallamu Allaikum!🌟
Dear Money Makers, Market Raiders & Silent Robbers, 🤑💰💸✈️
It’s time to gear up for the ultimate breakout heist on the JP225 / NIKKEI Index CFD Market. Based on my 🔥Thief Trading

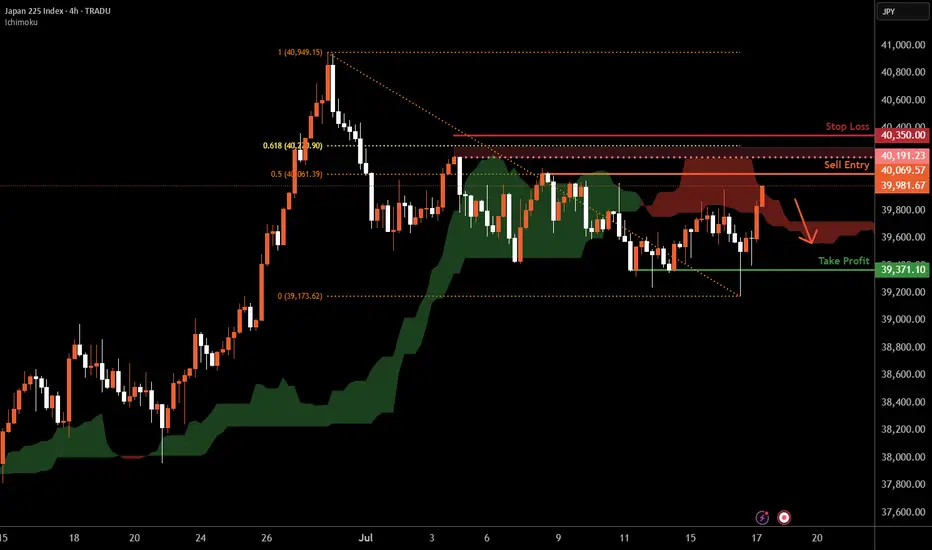
Nikkei 225 H4 | Swing-high resistance at 50% Fibo retracementThe Nikkei 225 (JPN225) is rising towards a swing-high resistance and could potentially reverse off this level to drop lower.
Sell entry is at 40,069.57 which is a swing-high resistance that aligns with the 50% Fibonacci retracement.
Stop loss is at 40,350.00 which is a level that sits above the 6
Trading breakouts in summer: Japan’s index pushes higherSummer breakouts are tricky with low market participation, but Japan’s stock index just cleared a major level. Whether it’s a rectangle or inverse head and shoulders, the breakout looks valid. We explore how to manage risk, trim stop losses, and aim for a solid reward ratio. Will this push continue?

Nikkei 225 D1 | Strong upward momentumThe Nikkei 225 (JPN225) is falling towards a pullback support and could potentially bounce off this level to climb higher.
Buy entry is at 40,670.02 which is a pullback support that aligns with the 23.6% Fibonacci retracement.
Stop loss is at 39,100.00 which is a level that lies underneath an over

NIKKEI Buy Plan — ATH Breakout Incoming!🚀 NIKKEI Buy Plan — ATH Breakout Incoming!
Buyers should stay alert and confident — NIKKEI is not just aiming to break its previous all-time high, it's preparing to print a brand new one. The recent price action shows strong bullish continuation, supported by:
✅ Weekly Fair Value Gap respected and

See all ideas