Understanding Reverse Repo Agreements: The Q1 Liquidity DanceUnderstanding RRPONTSYD: The Quarterly Liquidity Dance and Its Impact on Markets
The term RRPONTSYD, which stands for "Overnight Reverse Repurchase Agreements: Treasury Securities Sold by the Federal Reserve," might sound complex, but it's pivotal in understanding financial market behaviors, especially at the end of each quarter. Here’s an exploration of this mechanism, why it spikes, and what it means for liquidity and the stock market.
RRPONTSYD is essentially a tool used by the Federal Reserve where it sells securities to banks or financial institutions with the agreement to buy them back the next day. This process acts like a secured overnight loan from the banks to the Fed, designed to manage the money supply in the economy. Its purpose is twofold: to control short-term interest rates by offering a safe place for excess cash and to absorb excess liquidity from the system which could otherwise lead to inflation or push rates below the Fed's target.
Every quarter, RRPONTSYD tends to spike due to a combination of tax payments and financial reporting. Large sums are moved to the Treasury General Account for tax obligations, significantly reducing the cash available in banks. Additionally, banks engage in what's known as "window dressing," adjusting their balance sheets to look more robust for quarterly reports by using reverse repos to manage their liquidity or leverage ratios. This spike represents a temporary parking of cash at the Fed, often for earning a small return or to manage financial obligations.
The behavior of RRPONTSYD after this spike can have significant implications for markets:
If these agreements remain high after a spike, it signals that liquidity is being withheld from circulation. This can lead to higher borrowing costs and less capital available for investment or consumption, potentially resulting in a bearish outlook in the stock market as investors might see this as an indication of a tighter monetary policy or reduced market liquidity.
Conversely, a sharp drop in RRPONTSYD after a spike suggests that the cash is re-entering the financial system. This influx of liquidity can lower short-term rates, making borrowing cheaper and encouraging investment. The stock market often reacts positively to this scenario, viewing it as a bullish sign since there's more capital available for stocks, potentially driving up equity prices.
Understanding the dynamics of RRPONTSYD offers a window into how monetary policy, liquidity, and market performance are interconnected. Whether these agreements spike and then fall or remain elevated can serve as an indicator for market conditions. However, investors should always interpret these signals within the broader context of economic indicators, Federal Reserve policies, and global financial trends.
To conclude, today represents a significant point as the markets open for Q1 2025 as the vast majority were closed through New Years Day. Bullish investors want to see an IMMEDIATE drop in these rates with the most bullish scenario dropping below the 100 billion dollar mark by early next week. A significant drop is the LIKELY scenario as this scenario playing out indicates a high probability of upside continuation for the markets
Overnight Reverse Repurchase Agreements: Treasury Securities Sold by the Federal Reserve in the Temporary Open Market Operations
No trades
RRPONTSYD trade ideas

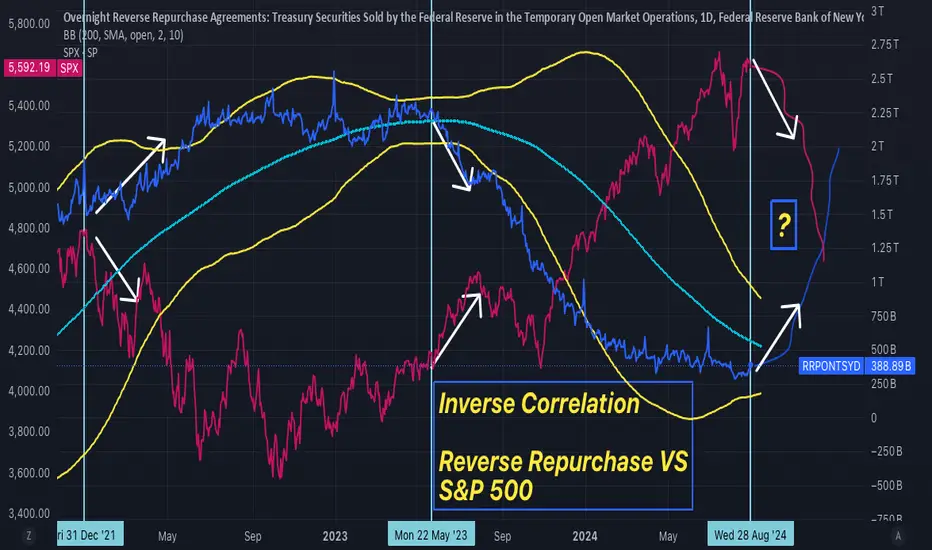
2008 and 2019 - Stock Market Crash: Similar Signs Now! S&P 5002008 and 2019 - Stock Market Crash: Similar Signs Now! -Reverse Repo and S&P 500: Inverse Correlation is Screaming.
Here are 5 Highlights:
1:: Quantitative tightening has been underway since June 2022, and the Fed will have to make a Big Move- iin September 2024:
2:: The overnight reverse repo facility is now getting down to low levels, raising questions about whether another breakdown in financial market liquidity and stress in short-term funding markets could occur.:
3:: On January -2022, the chart shows that the REVERSE REPO started to increase and at the same time S&P 500 started to drop, showing an almost perfect inverse correlation.:
4:: What Happened in the 2008 G-F-C - Quantitative tightening, and in September of that Year?
5:: What was the: dash for cash, and what happened in the September 2019 Repo Crisis?
Quantitative tightening (QT) has been underway since June 2022, with the Fed shrinking its balance sheet in order to bring reserves and liquidity in the financial system back down to more normal levels.
The CME's FedWatch Tool forecasts that the federal funds rate will most likely end 2024 at 4.25% to 4.5%. If so, that's a full percentage point lower than current rates. However, there's substantial uncertainty around that estimate and a higher, or lower, degree of policy accommodation is possible;
The overnight reverse repo facility is now getting down to low levels, raising questions about whether another breakdown in financial market liquidity and stress in short-term funding markets could occur.
I believe that an unexpected rate spike, similar to September of 2019 is unlikely, considering the current liquidity conditions, but the chart I have created triggered a Warning Sign.
As you can see, usually there is a clear Inverse Correlation with REVERSE REPO, and the US STOCK MARKET.
On January -2022, the chart shows that the REVERSE REPO started to increase and at the same time SPX started to drop, showing an almost perfect inverse correlation.
On May - 2023, the chart shows SPX, at the start of a Bull Market as REVERSE REPO is on a Downtrend.
What I have noticed, is that when they are running beside each other, at some point they start to go in the opposite direction, and when they are far apart from each other, at some point they start to converge, going in the opposite direction, crossing at some times.
Since they are really far from each other, the next inverse correlation move could be huge.
So, the question is, the pattern will follow, and if it does how much will the stock market Crash when Reverse Repo starts to spike UP?
For now, I do not see a breakout of the Downtrend for Reverso Repo, but we need to keep very close attention when that happens, to review our stop loss.
Since I have never seen this analysis between the Reverse Repo and the US Stock Market, I had to publish it as soon as possible to warn as many people as I could, of what could happen, anytime from now.
If you know anybody who has made this analysis, let me know in the comments below.
What is the Reverse Repurchase Agreement?
A reverse repurchase agreement (RRP), or reverse repo, involves the sale of securities with an agreement to repurchase them later at a higher price on a specified future date. It represents the seller's perspective in a repurchase agreement (RP), or repo.
The difference between the initial sale price and the repurchase price, along with the timing of the transaction—often overnight—represents the interest paid by the seller to the buyer.
In the U.S. repo market, more than $3 trillion in short-term funding is provided daily, with most transactions being overnight and collateralized by Treasuries. Repos are commonly used for short-term borrowing and lending.
How Does a Reverse Repo Work?
In a reverse repo, a party in need of cash reserves temporarily sells a business asset, equipment, or shares in another company, with an agreement to repurchase them later at a premium. The buyer of the assets in a repo agreement earns interest for providing liquidity to the seller, while the underlying collateral helps mitigate the risk of the transaction.
Example of Reverse Repurchase Agreements
Consider Bank ABC, which has excess cash reserves and wants to earn a return on them. Meanwhile, Bank XYZ faces a reserve shortfall and needs a temporary cash infusion.
Bank XYZ may enter a reverse repo agreement with Bank ABC, selling securities to Bank ABC to hold overnight and agreeing to buy them back at a slightly higher price the next day. From Bank ABC’s perspective, this transaction is a repurchase agreement.
How Does the Federal Reserve Use Reverse Repos?
When the Federal Reserve engages in a reverse repo, it sells securities with an agreement to repurchase them later. In doing so, the Fed borrows money from the market, which can help absorb excess liquidity in the financial system.
The Bottom Line
A reverse repurchase agreement (RRP), or reverse repo, is the sale of assets with an agreement to repurchase them later at a higher price. Essentially, it functions as a short-term loan with the sold assets serving as collateral.
What Happened to the Repo Market during QE of 2008, and What happened in September of that Year?
During the 2008 financial crisis, the repo market faced severe liquidity stress as financial institutions struggled to obtain short-term funding. The repo market, where institutions borrow cash by selling securities with an agreement to repurchase them later, is a crucial source of liquidity for banks and financial firms.
However, as the crisis unfolded, the value of the collateral—primarily mortgage-backed securities and other complex financial instruments—plummeted. This led to a sharp increase in haircuts (the discount applied to the collateral), causing lenders to demand more collateral for the same amount of cash.
The resulting lack of confidence in counterparties and declining asset values led to a run on the repo market, where borrowers were unable to roll over their repos or obtain new funding. This liquidity crunch intensified the financial crisis, leading to the collapse of major institutions like Lehman Brothers and prompting the Federal Reserve and other central banks to intervene by injecting liquidity and expanding their roles in the repo market to stabilize the financial system.
During the 2008 financial crisis, U.S. bank reserves became scarce in the period leading up to the implementation of Quantitative Easing (QE) by the Federal Reserve.
So, what happened in September 2008?
This scarcity of reserves was most pronounced in the fall of 2008, especially following the collapse of Lehman Brothers in September.
At that time, the interbank lending market froze as banks became increasingly risk-averse and reluctant to lend to one another due to fears of counterparty default.
This resulted in a severe liquidity crisis, making reserves—cash that banks hold at the Federal Reserve—scarce. Banks hoarded reserves to ensure they could meet their own funding needs, leading to a sharp increase in the cost of borrowing reserves, as reflected in the spike of the federal funds rate above the Fed's target.
To address this, the Federal Reserve initiated a series of emergency measures:
Liquidity Facilities: The Fed introduced several facilities, such as the Term Auction Facility (TAF) and Primary Dealer Credit Facility (PDCF), to provide liquidity to banks and primary dealers.
Quantitative Easing (QE): Beginning in late 2008, the Fed started its first round of QE, which involved purchasing large quantities of longer-term securities, including U.S. Treasuries and mortgage-backed securities (MBS). These purchases injected substantial reserves into the banking system, alleviating the scarcity of reserves and lowering borrowing costs across the economy.
By increasing the supply of reserves through these measures, the Fed aimed to stabilize the financial system, restore normal functioning to credit markets, and support economic recovery.
With the advent of quantitative easing in 2008, the U.S. Federal Reserve (Fed) moved from a scarce to an ample reserves regime. The Fed used to control rates by managing the supply of bank reserves so that interest rates would clear at target.
But now banks frequently hold substantial reserves. These reserves are now managed and incentivized by the Fed, which pays interest rates on reserve balances (IORB).
Non-banks, such as money market funds, can also park money at the Fed’s Overnight Reverse Repo Facility.
These two mechanisms act as a floor system, allowing the Fed to control short-term interest rates. For example, if interbank rates fell below IORB, a bank could make more money using the Fed facility and would do so.
What was the: dash for cash, and what happened in the September 2019 Repo Crisis?
The recent dash for cash highlighted the importance of understanding liquidity stress dynamics in key funding markets.
The sharp spikes in repo rates in March 2020 were clear signs of severe liquidity stress. We previously observed similar stresses in money markets when reserves became scarce in September 2019.
The Fed's quantitative tightening (QT) began in the fall of 2017, and by mid-September 2019, $700 billion in reserves had been drained from the financial system.
What Happened in September 2019?
On September 16, 2019, $70 billion was withdrawn from banks and money market funds to meet quarterly tax payments. Simultaneously, $50 billion in long-term Treasuries settled, which were purchased by dealers, further straining their reserve positions.
At that time, hedge funds significantly ramped up their borrowing, and repo spreads widened, particularly in the bilateral segment of the market, where banks and gilt dealers were lending at much higher rates compared to borrowing from non-banks.
Will the Fed respond the same way this time? Could the same liquidity-type crises happen again?
First, it's important to recognize that in 2019 and 2020, the Fed used repos reactively as a firefighting tool to address liquidity crises. Learning from these market disruptions, the Fed established a new standing repo facility (SRF) to proactively provide liquidity whenever needed. This facility has a capacity of $500 billion, which is expected to be sufficient to handle liquidity demands during future periods of stress.
Additionally, the Fed introduced another repo facility called the Foreign and International Monetary Authorities (FIMA) Repo Facility, allowing foreign central banks to access dollar liquidity. Generally, the Fed aims to avoid repeating past mistakes.
Reflecting this, the Fed recently announced a reduction in the pace of quantitative tightening (QT) for its Treasury securities from $60 billion to $25 billion per month, partly to lower the risk of another liquidity crunch.
Looking ahead, a new ruling by the U.S. Securities and Exchange Commission (SEC) from December 2023 mandates a shift to central clearing of repos by June 30, 2026.
What could still go wrong?
The Treasury market seems more fragile now than it was before the Global Financial Crisis (GFC). Algorithms account for 60%-80% of trading depth at any given time, but they tend to shut down during periods of high volatility, such as market scares. This can exacerbate fragility during risk-off events, especially with dealers constrained by post-GFC capital rules.
There is a circular relationship between the Fed and the markets. The Fed cannot precisely determine in advance when reserves will shift from being ample to scarce; instead, it relies on market signals and pressures to gauge when a tipping point might be near.
Speaking at the U.S. Monetary Policy Forum in New York on March 1, 2024, Fed Governor Christopher Waller noted that increased use of the Standing Repo Facility (SRF) could indicate that reserves are nearing an ample level. However, this still leaves directional illiquidity risks in the market, even if those risks are somewhat mitigated by the new backstop measures.
The bottom line
What is beginning to happen is that there are new protocols in Treasury markets for trading all-to-all participants. These algorithms will reduce capital, and hedge funds will begin to step in. As these protocols get built out, more non-traditional price makers and market participants will be able to help support unexpected stress in the Treasury market.
The institutional features are in place and have changed the market structure to reduce the risk of a repeat of 2008 and 2019, but everything has a limit at some point, and something is unbreakable until it breaks.
This lesson we all have learned from Titanic is: never doubt about a natural force's power. I believe, that even the abstract reality of money and markets follow the same principle, and when this natural force decides to act, no one can stop it, otherwise they could've prevented what happened in 2008 and 2019.
Technical analysis is not 100% perfect, as any other financial instrument that tries to predict the market, but the signals I have captured from the Inverse Correlation of the US Reverse Repo Market and the US Stock Market, are Very Strong.
If the US Reverse Repo market starts a strong Uptrend, it could trigger the Stock Market Crash.
Since, we are expecting big moves from the Fed in September, which is a regular period of withdrawal from banks and money market funds to meet quarterly tax payments, volatility is on the way; maybe the Fed will be able to hold liquidity steady, but only time will tell.
From my experience, this is the best time to review all investment strategies cutting risks as much as possible. Let's hope for the best while preparing for the worst.
- Good Luck and Good Profit My Friends:
Disclaimer:
The information presented on this channel is for news, education, and entertainment purposes only. The information does not constitute an offer or solicitation to buy or sell any investment product(s) or investment strategies, or a substitute for professional investment advice. It does not take into account your specific investment objectives, financial situation or needs. I am not a financial advisor or a licensed investment professional. Please consult with your financial advisor before following any investment strategies discussed in this channel.
,
btc/rrpas i come from hibernation to give you the mother of all shorts... BTC and i have multiple reasons why... 1. groups.csail.mit.edu 2. japan carry trade (alot of crypto was purchased using negative loans in yen) and 3. giving the keys to larry tinkle finkle (the OG financial crisis architect). laugh all you want if im wrong im wrong and ill be able to offload my bag at 100k like the rest of the masses, or im right will have a massive discount and still sell my bag high and have a great opportunity to buy more...

The market bottomed when Reverse Repo peaked.The market bottomed when Reverse Repo peaked.
After Reverse Repo started trending down, the market started its path up to new All time highs.
Liquidity as measured by M2 has been picking up which explains why we see prices making or approaching new ATM

Rally since 2022 based on Reverse Repo Drain $QQQ $SPY $SPX $NDXThe entire rally since October 2022 has been based on the rapid depletion of the Fed's reverse repo. When the RR drains rapidly, the money flows directly into the stock market. When the RR gains, it precurses a drop in the stock market.
At each pivot point the stock market has followed suit. We just had the most recent pivot on March 15th through today adding 43% back to the reverse repo. If this increases further, the stock market should move lower.


The Potential Consequences for the U.S. Debt CrisisFrom zetalon.com
The article by Ming Wong explores the significant financial consequences if the Overnight Reverse Repurchase Agreement (ON RRP) facility reaches a zero balance. Managed by central banks like the Federal Reserve, the ON RRP is crucial for controlling short-term interest rates and managing bank reserves. Following the trend depicted in the article, there could be a complete unwinding of ON RRP agreements by late 2023 to early 2024.
This unfolding scenario would have several ripple effects:
Short-term Liquidity Crunch: A zero balance in the ON RRP would severely limit short-term investment options, leading to a liquidity crunch. This would push up the demand for other short-term securities, subsequently increasing their yields.
Impact on Broader Interest Rates: The rise in short-term rates would likely cause a shift in the entire yield curve, affecting medium to long-term rates.
U.S. Debt Crisis: With a debt burden nearing $33 trillion, the U.S. would find itself under more pressure due to rising short-term interest rates, leading to higher debt service obligations and less fiscal flexibility.
Foreign Creditor Dilemma: The increasing difficulty in servicing U.S. debt could reduce the confidence of foreign creditors, possibly leading to decreased demand for U.S. securities or even divestment.
Credit Rating Risk: Credit rating agencies might reevaluate the U.S.’s creditworthiness, potentially leading to downgrades that would further increase borrowing costs.
In summary, a complete unwinding of ON RRP agreements by late 2023 to early 2024 would not only lead to short-term liquidity challenges but would also escalate borrowing costs, disrupt fiscal policy, and diminish global confidence in U.S. financial stability.

The Overnight Reverse Repo Facility Looks to be Bottoming OutMoney that has been parked at the Fed's Reverse Repo Facility due to the attractively high interest rates the Fed has set for money parked there has been on a steady decline since late 2022, and recently, this year we confirmed a breakdown of a Bearish Dragon, which led to a BAMM move down to complete a Harmonic M-shape.
This then represented an influx of liquidity exiting the facility and effectively hitting circulation, which led to that money chasing assets and commodities. This chasing of assets and commdoities effecctively backed the 2023 Stock Market Rally.
The target I had set for this move was down to the 0.886 of a Bullish Bat and now months later we can see that we came very close to it, but it would seem that rather than getting a full 0.886 retrace we are instead getting a confirmation-styled RSI reaction as price Bounces from the 1.618 Extension, which just so happens to align with an AB=CD formation it's made on the way down.
I see this as an indication that the liquidity will soon stop flowing out from the facility and that liquidity will now begin to flow back to the facility, effectively taking money out of circulation, which would likely result in a decline in asset prices and a decline in the trading of Short Term Debt on the open market, which could then lead to Short Term Yields rising overall along with the US Dollar as institutions once again begin to lock up their dollars in this facility and chase yield rather than assets.
Recently, I have been seeing a lot of weakness in the banking sector. That weakness may act as a catalyst for these institutions to once again park their money with the Fed, just as it did before. As always, my target for an ABCD is back to the Level of C, so we should see this rising back up about 30% before we can start looking for signs of this topping out again.

US T-Bill issuance - measure the liquidity drain on TradingViewIn this video we look at the impending $800b T-bill issuance from the US Treasury to rebuild its cash levels at the TGA – will this lead to higher volatility in financial markets as reserves are taken out of the system?
Will concerns on bank credit kick back up, or will this prove to be a non-event?
We look at the indicators you need can use in TradingView to monitor this situation effectively.

The Overnight Reverse Repo Facility Looks to be Breaking DownMoney that is being parked at the Feds Reverse Repo Facility due to attractively high interest rates the fed has set for money parked at the facility has been on a steady decline since late 2022 and we have now confirmed a lower high and are looking to break down below a Bearish Dragon trend line that could be the initial trigger that gets it started to going down all the way to an 88.6% retrace or lower even. One can only speculate that the money exiting this facility will lead to more trading of short term debt on the open market, which could eventually lead to yields coming down overall and for all of this excess liquidity to chase Equities instead as the value of the US Dollar declines due to the shock of all this newly added supply of liquid cash to the open market thereby causing a loosening of market conditions.

Reverse repo is breaking bullish trendThe Overnight Reverse Repos is breaking the bullish trend and slowly coming down.
This means liquidity is coming back to the markets and the overnight FED fixed interest rates is no longer that attractive for the parked capital.

If there was ever a sign that says follow the fedI am watching this closely. This will tell me if I can remain bearish or if I should flip bullish. I can not express in words how important this is, especially if you understand what this chart means......

RRP the Fed's Soft Landing Tool for 2022?RRP unwind with raising rates could seem viable for a soft landing in the US equities markets and broader economy in 2022. Lots of major headwinds regardless.
Thanks for reviewing. Please let me know your thoughts. Just my personal thoughts and opinions, not financial advice or education. Cheers.

RRPs - Reverse Repurchase AgreementsAn increase in the reverse repo rate will decrease the money supply - ceteris parabis.
Commercial bank incentives to hide their funds with the RBI, decrease the supply of
money in the markets.
There is a limited leak from RRP Pool back and forth, but the overall trend remains
higher.

Reverse Repurchase Agreements - New ATHWhee.... fear....
When the Criminals are running for the Hills...
Ya may wanna consider the same....
CASH best if you have no clue what to do.

6/10/2022 Look Out Below! Market Selloff Imminent ***This does not constitute financial advice of any kind as I am not licensed for such opinions***
The markets selloff on a shocking CPI print, but this is to be expected. The real shock comes when you realize how far we have to fall. S&P, DXY, and Gold are covered.
The crypto markets may have their underbelly exposed to sunlight as an ominous development is set to take place next Tuesday June 15, 2022 (BTC, ETH, XRP, XLM, ADA, ALGO, SOL).
An error was made during the creation of this video where I quote an article from 2021. The Reverse Repo market has run miles away from when that article was published. But on the heels of the liquidity crisis theme, look on ZeroHedge for "Fed Liquidity Drain is Coming" on March 30, 2022
***This does not constitute financial advice of any kind as I am not licensed for such opinions***

RRPONTSYD. P-Modeling Pt A. Reverse Repo of Cajun Welcome Hyperspace Travelers,
I only post the most interesting "coincidences". To which, I regard; there is no such thing.
Can you find it? Look closely..
Don't tell anyone once you do...
It's our little secret.
SPX Target: 1000-800.
Our future is already mapped..
Is such an absurd notion possible?
Stay tuned to find out, whether in the shadows or in voiced opposition.
Nature is my executioner.
You are my witness.
Tic. Toc. Tic. Mr. Owl.. How many licks does it take to get to the center of a tootsie pop?
Infinite licks..
Thanks for Pondering the Unknown with Me,
Glitch420

Reverse Repurchase AgreementsThey're back.... and expanding while reducing liquidity once again as the Markets move higher.
Sopping up all the spooge that is Quantitative Finance aka - Financial Engineering..
Pejorative?
Hardly - the Market for Stocks is the Eocnomy.
Now more than ever.

Reverse Repurchase FacilityReverse Repurchases are a clear indication of excess liquidity in the
Banking / Financial System.
Money Center Banks have monies in excess after meeting obligations
to the following:
Liabilities
Investments
Lending
An increase in the Reverse Repurchase activity will decrease the money supply.
Reverse Repurchases mean that commercial banks are provided more incentives
to park their funds with the Central Bank - decreasing the supply of money in the market.
RRA's soak up excess Liquidity.
As we can see they have broken Trends should be expected as CASH is within
Overnight Reverse Repo Facilities @ $500Billion assist in providing support for
overnight interest rates by acting as an alternative investment for a broad base of
money market investors when rates fall below the interest on reserve balances.
This is facility is not for public consumption, but Primary Broker / Dealers and
Money Center Banks and Financial Institutions.

Reverse Repurchase AgreementsRemains in Trend for 2022 to $2 Trillion.
FED Supportive of collaterals.
No end in sight...
____________________________________
Monday Coupon Purchases begin the New Year
@ $8.7 Billion.
FED Balance Sheet - New all-time HIgh @ $8.791 Trillion.
_____________________________________
May your New Year be filled with Peace and Joy
Until 2022 - HK

Reverse Repos - Same Fear as SeptemberNot much to add to today's commentary.
Fed Policy error, defense of the indefensible.
APPLE Hanging on by a thread.
Sell Confirmed.
________________________________________
Congrats to the True Believers
Entry, once again near Perfect.

Reverse Repurchase AgreementsA picture is worth 1000 words.
Horrific dependency on FED Prop.
Nullified
