Expect multi year SP500 down trend to begin.When unemployment rate crosses 12 month ma signals long term trend change in SP500.
Rate just crossed to upside, expect multi year SP500 down trend to begin.
UNRATE trade ideas

WARNING: Beware of RecessionWhenever the unemployment rate has crossed above the 12 month moving average, almost always a recession has soon followed. Here we are now.

Recession Looming.Private Update of a chart copied earlier from someone here on TV a while back
Can't remember who


MACD and StochRSI accurately predict unemployment ratesNext month's unemployment rate will determine if the MACD crosses and if we could potentially enter into a recession

Chart Identifying When A Recession Starts When the 3 Month Unemployment Average Goes Above The 3 Year Moving Average A Recession Is In Progress.
The chart above shows every recession from 1953 to 2008 and shows when the moving average occurrence takes place it's a recession.

Unemployment Prediction Model with Scary Accuracy!This RSI-MA Model Predicts Unemployment Rate With Scary Accuracy!
Although high unemployment usually occurs during economic recessions, it doesn't always mean that equity valuations would drop, nor does rising unemployment always mean recession.
On the monthly chart of the official national unemployment rate:
Unemployment Momentum Rising = MA6(RSI3) cross>50
Unemployment Momentum Dropping = MA6(RSI3) cross< 50

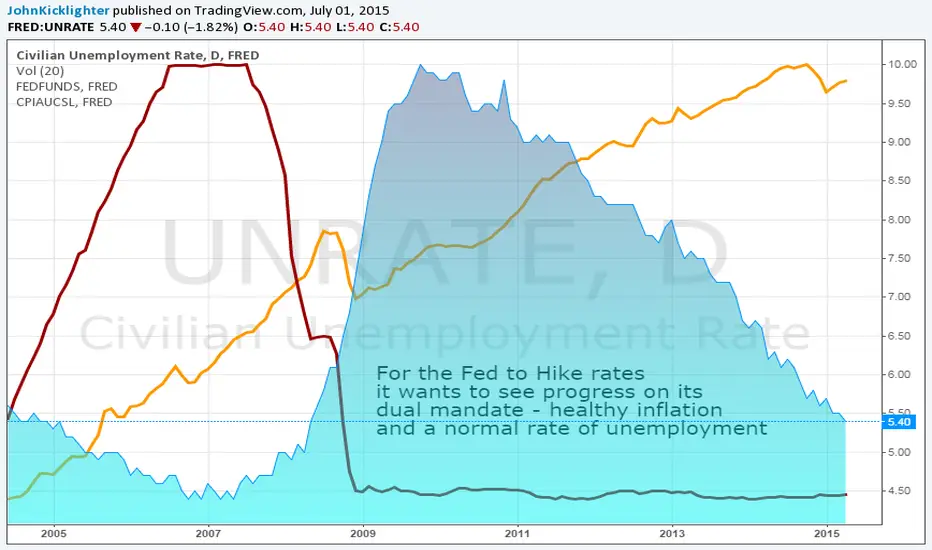
Timing the First Rate Hike on the Fed's 'Dual Mandate'The Fed's rate hike timing is 'data dependent'. Few data points are as comprehensive and influential for determining monetary policy than the BLS's monthly labor statistics. The unemployment rate is good for the employment element of the mandate, but there is also an inflation gauge: wage growth. Will this data offer enough of a push to shift interest rate expectations - hawkish or dovish?
UNEMPLOYMENT RATE NOW WITHIN TOUCHING DISTANCE OF NAIRU ESTIMATEOctober was the ninth consecutive month where the headline payrolls figure came in above 200k, rendering this year’s January to October period the strongest in fifteen years. The US NAIRU may be 5.2% or it may be 5.7%. But wherever it lies, the actual unemployment rate is moving swiftly towards it.
Friday’s Employment Situation Report showed that the US economy added 214k jobs last month. Although weaker than most forecasters – Fathom included – had expected, it was nevertheless the ninth consecutive month where the headline payrolls figure came in above 200k, rendering this year’s January to October period was the strongest in fifteen years.
In its latest policy statement, the FOMC acknowledged that “underutilisation of labor market resources … … gradually diminishing”. Previously, underutilisation had been described repeatedly as “significant”. In our view, the US labour market is tightening rapidly. The four-week moving average of initial jobless claims fell to 279K in the week-ending November 1st – the lowest reading in more than fourteen years. The non-manufacturing ISM employment index can also be helpful in predicting payrolls from time to time, and this rose sharply in October to 59.6. It was the combination of weak initial claims and a strong reading on the ISM survey that had led us to expect a stronger payrolls figure this month; our own forecast was for an above-consensus rise of 300k.
The headline unemployment rate fell by 0.1 percentage points to 5.8% in October. According to the OECD, US unemployment is already below the non-accelerating inflation rate of unemployment, or NAIRU. It is just 0.1 percentage points above the Congressional Budget Office (CBO) estimate of the short-term NAIRU, although it remains 0.3 percentage points above the central tendency range of FOMC members’ forecasts of the longer-run unemployment rate.
The salient fact is that, wherever the precise value of the NAIRU might lie – and there will always be some uncertainty about this – the actual rate of unemployment is closing in on it rapidly. In fact, it is unprecedented for the gap between the actual unemployment rate and the NAIRU to diminish so rapidly while policy remains on hold.
If the labour market continues to tighten then this should soon feed through to stronger wage growth. Growth in average hourly earnings remained at 2.0% in the twelve months to October according to the Bureau of Labor Statistics. But the Employment Compensation Index for private industry workers – the measure that includes wages, benefits and bonuses – rose at its fastest pace in over five years in the four-quarters to Q3. One data point does not seal it, of course. However, the National Federation of Independent Business survey, which has good leading indicator properties, also shows that the net proportion of small firms planning to raise wages is the highest since December 2008.


