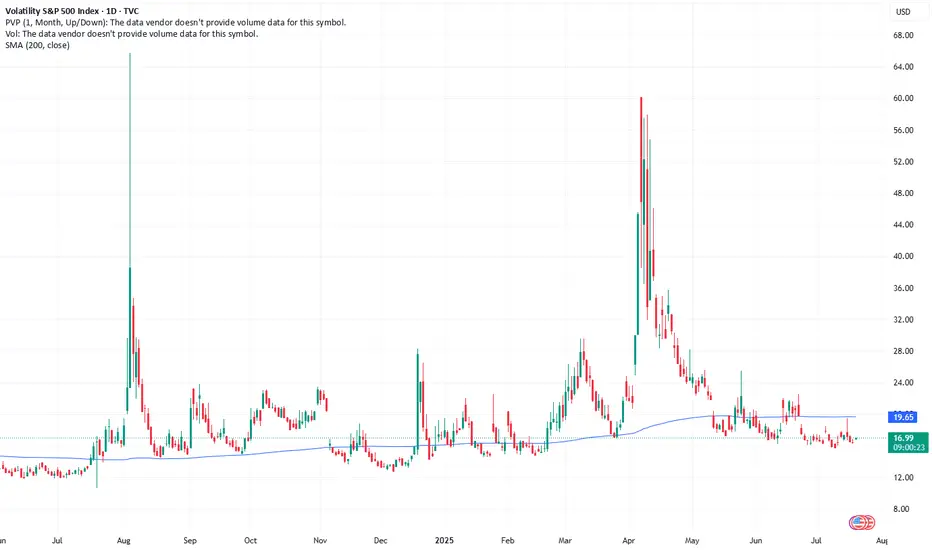
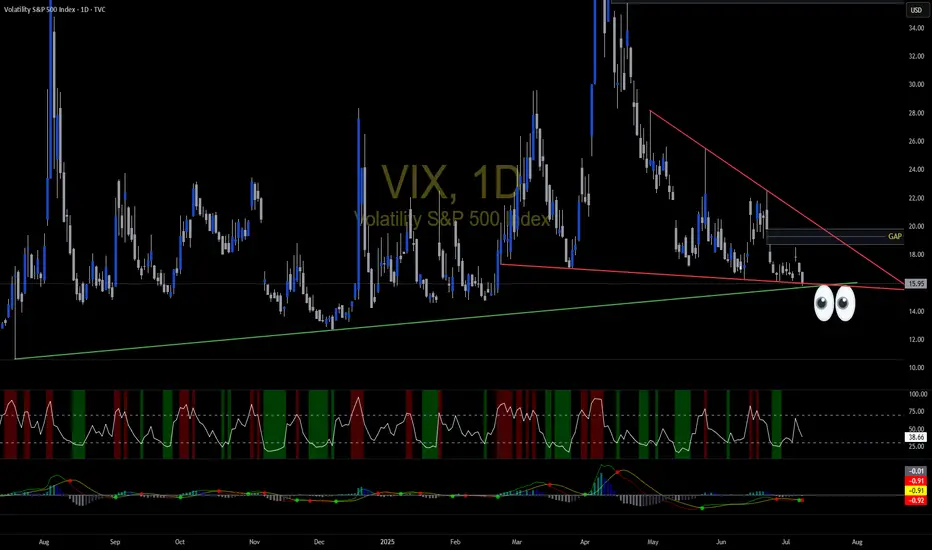
Go Long on VIX: Predictions for Increased VolatilityCurrent Price: $16.41
Direction: LONG
Targets:
- T1 = $17.50
- T2 = $18.25
Stop Levels:
- S1 = $15.90
- S2 = $15.65
**Wisdom of Professional Traders:**
This analysis synthesizes insights from thousands of professional traders and market experts, leveraging collective intelligence to identify high-probability trade setups. The wisdom of crowds principle suggests that aggregated market perspectives from experienced professionals often outperform individual forecasts, reducing cognitive biases and highlighting consensus opportunities in VIX.
**Key Insights:**
The VIX, commonly referred to as the "Fear Index," is currently hovering at historically low levels of 16.41, well below the psychologically significant threshold of 20. This indicates a relatively calm equity market, but traders know all too well that complacency often precedes sharp volatility spikes. Key breakout levels range between 18 and 19, with the potential to test mid-20 range if significant macroeconomic or geopolitical events materialize. Traders are advised to consider hedging strategies while monitoring these thresholds closely.
The current low-volatility environment reflects broad market optimism, but it also suggests the possibility of a quick reversal. Historically, prolonged periods of suppressed VIX readings can lead to sharper corrections when fear abruptly rises. For this reason, traders should stay vigilant, particularly with major economic events on the horizon.
**Recent Performance:**
Over the past few weeks, the VIX has steadily declined, breaking below 17 and reaching the current zone of 16.41. This downward momentum aligns with bullish equity markets, where major indices like the S&P 500 continue to hover near all-time highs. This subdued state demonstrates investor confidence but warns of potential complacency risks.
**Expert Analysis:**
Market analysts emphasize the importance of the 18-19 zone, which serves as a critical resistance range. A sustained breakout above these levels could lead to a move into the 20-25 range, driven by renewed market uncertainty. Technically, the VIX remains oversold, implying the probability of an upward momentum shift soon. Experts point to factors such as Federal Reserve policy statements, inflation data, and geopolitical surprises as potential catalysts. Overall, professional sentiment skews towards a medium-term bullish stance on VIX.
**News Impact:**
Recent market headlines indicate hedging activities through August and September VIX futures, preparing for a potential volatility spike tied to macroeconomic concerns or policy announcements. Additionally, the simultaneous drop in the MOVE index—a measure of bond market volatility—further signals market complacency, raising questions about whether markets are adequately pricing in risks. These factors, combined with historically low VIX levels, suggest that a volatility breakout is on the table in the coming weeks.
**Trading Recommendation:**
With the VIX at suppressed levels, traders have an opportunity to position themselves for a potential upside. Going long on VIX with an initial target of $17.50 and a secondary target of $18.25 provides a favorable risk-to-reward setup. Stop-losses at $15.90 and $15.65 help manage downside risks effectively. This strategy aligns with historical patterns where low VIX levels are followed by periods of heightened volatility, especially during critical market junctures.
VIXCLS trade ideas
VIX Alarting !when VIX Reach Red Zone.
It consider as Extreeemeee Greeeed !!.
100% market will take U-Turn direction which will be Red in Up coming days !
although im day trading im good and never keep money in market after close.
VIX possible long?As equity markets continue to approach all-time highs and expectations of interest rate cuts increase, market sentiment remains highly optimistic. This environment of "good news" characterized by strong performance in equities and the anticipated easing of monetary policy is likely to suppress volatility in the short term, potentially pushing the VIX down into the 12–15 range.
However, this period of euphoria may mask underlying risks. Stock valuations appear stretched, and the crypto market is exhibiting signs of overheating. If corporate earnings begin to miss expectations or if signs of economic slowdown emerge particularly if the economy shows signs of overheating before stabilizing market sentiment could shift rapidly. In such a scenario, volatility may spike again, with the VIX potentially rising back into the 20–25 range as uncertainty returns and risk appetite diminishes.
-Disclaimer: This analysis is for informational and educational purposes only and does not constitute financial advice, investment recommendation, or an offer to buy or sell any securities. Stock prices, valuations, and performance metrics are subject to change and may be outdated. Always conduct your own due diligence and consult with a licensed financial advisor before making investment decisions. The information presented may contain inaccuracies and should not be solely relied upon for financial decisions. I am not personally liable for your own losses, this is not financial advise.
Weekly Volatility ReadGood Evening --🌗 🌕🌓
I hope everyone is having a relaxing weekend with friends and family alike because soon we will be in the thick of the price action again -- and it may get spicy! Let't us dive in as we review what happened last week and we look towards the next to trade range or observe.
The CBOE:SPX opened the week fairly slow at $6,193.18 and increased throughout the week wicking up to a new ATH of $6,315.61 only to close the week off at $6,267.28 -- This leaves the IM on the week +$83.10. This closest respects the quarterly implied range that was a 'strength of IV' of 129.30%.
Now looking towards this next week we have extremely low HV across the board in the broader markets. CBOE:SPX IV (13.14%) is trending 32% IV percentile on the year -- premium is seemingly cheap. HV10 (6.97%) is coiled within 97.67% of it's sliding yearly lows, showing a need for short-term volatility to consolidate. HV21 (7.78%) is even more coiled to it's yearly low at 98.76% respectively. Both are roughly mid 50% 'strength to IV' as IV predicts twice the potential move next week.
Lastly, HV63 our quarterly trending values is showing a 'strength of IV' at only 108% but, could be supporting the thesis IV is projecting, as we do need a TVC:VIX pop OR time-wise consolidation. 📈📉
I hope everyone has a great week trading ranges and I will see you next weekend!
Cheers! 🍻🍻🍻
15.40This channel is not providing individualized trading or investment advice, nor is it a banking service, brokerage service, trading service, investment service or money management service

Weekly Volatility Snapshot Good Evening --
I hope everyone is having a restful weekend and enjoying your time away from markets. Always appreciate it while you can, and spend that precious time with loved ones. Now, let us review the price action last week as we look towards our expectations for the coming trading sessions.
The CBOE:SPX opened the weekly candle at $6,126.15 and closed $6,252.50 -- this respectively puts the weekly move at +$126.35. This is slightly above what IV was stating entering the week. We are starting to see seasonality set in as the markets top and look for consolidation. The TVC:VIX dropped throughout the week putting a bottom in at $15.70 which shows volatility creeping to it's lowest point year-to-date.
We should all expect a volatility bounce in the near future as the run the broader markets have made out of the steep correction needs to cool off before moving forward. Below is my volatility read for the S&P 500. You will see that HV10 (7.94%) is coiled within 3.30% of its sliding yearly lows. This tells me between the low sentiment in fear and the low volatility in short-term trends, we need to cool off a little.
Now looking towards this week, I see the broader markets consolidating and even selling off in order to reset the overbought 'lagging' indicators and pop the VIX up a little bit. The administration has pushed the trade deal deadline off till AUG 1st providing some relief to the markets but, has also created more uncertainties with tariff letters that went out Friday.
Look for a negative news cycle sparking up Sunday night into Monday, potentially creating momentum downwards. However, I believe we stay in range of what HV10 weighted to IV implies -- $6,207.72 - $6,311.78. This range holds a divergence from IV of 5.29% and and price gap difference of -$17.32. To me, this says that what is short-term trending is 'contractive' to what IV states.
That's all for this week. Stay hedged against your bias always and remember to practice your ABCs -- If you like what you are reading and love volatility range analysis as much as i do -- feel free to drop me a comment and ill get back to you! Till next time, Cheers!

Weekly Volatility SnapshotGood Evening -- Happy July 4th to everyone
Let us review last week as we look towards the next in anticipation of the trade deal deadline that looms. I had a target on the SP:SPX of $6,253.59 and the weekly high was $6,284.65. The candle on the short week opened at its low of $6,019.21 and closed $6,233.08 making the weekly range +$213.87. This represents closest to HV63 over IV which stated +/-$253.26 and a 'strength of IV' that was 295% . Again the weekly high is above our range target, but my volatility will always be measured close-to-close.
Now as we look towards this week --
IV (13.85%) has shifted upwards slightly with HV10 (7.36%) hinged down and still lowering. In fact, I have bi-weekly volatility as 97.28% 'coiled' to it's sliding yearly low of 4.64% -- HV21 (9.92%) is closer to what IV states with it being 'coiled' 96.61% to it's respective sliding yearly lows.
In my opinion, volatility still has room to consolidate slightly as markets rotate higher. I think we can see upwards $6,327.73, but slowly over the course of the week with the last tariff uncertainty getting out of the way. From there, going into mid July we may need to see a volatility spike. The HV10 range I am watching holds a 'strength of IV' entering this week of only 53% -- this shows the price per move is expensive by almost twice as much.
Till next time, know your ABCs, have a great long weekend, and stay hedge!
CHEERS

How I Manage Risk (When Buying Options) If you’ve read my previous post — “How Much Risk Are You Really Taking?” — you already know my view on risk:
Treat every trade like watching your cash burn in front of you.
Ask yourself:
💭 “Would I be OK watching this much money disappear right now?”
If your answer is yes, take the trade and move on.
If it’s no, don’t do it — resize it.
🚫 What Not to Do:
Many traders fall into the trap of:
“I’ll think about it later”
“I’ll set a mental stop and cut if it hits my level…”
That approach has two fatal flaws:
#### ❗ 1. Execution failure
You might not react fast enough when the market hits your level — or worse, you’ll forget to act at all.
#### ❗ 2. Emotional resistance
Even if your stop level is hit, will you actually cut?
Probably not.
Human nature avoids pain and chases pleasure.
Cutting a loss — even a planned one — is painful. That’s why mental stops often fail.
Mental stops:
Add more burden to monitor
Add more emotion to your decision-making
That’s why I keep it simple.
---
✅ My Risk Rule for Buying Options:
Every dollar of premium I spend is 100% acceptable to lose.
This way:
I don’t need a mental stop.
I don’t need to watch it every second.
I sleep well, regardless of outcome.
---
📊 How Much Do I Risk?
It depends on account size and account type:
#### 📌 Main Account:
Risk 1–2% per trade
Never more than 5% on a single trade
Rarely hold more than 3 trades at once
Targeting 6–10% total exposure, only if trades are uncorrelated
⚠️ SPY & QQQ are NOT uncorrelated — don’t fool yourself.
#### 📌 Small Account:
Can risk 5–10% per trade, but only on A+ setups(See: “What’s Your Catalyst?” for what qualifies as A+ in my book)
The goal of a small account is different: it’s about growth — but still must be strategic.
---
💰 “But How Can I Make Big Money Risking So Little?”
This is the common pushback I get:
“Shouldn’t we take big risks to get big rewards?”
Sure — high risk = high reward.
But high risk also = high chance of blowing up.
Even if you hit a few big winners, you’ve compromised your long-term survival.
That’s not trading. That’s gambling.
---
🧠 What I Actually Look For:
Low Risk / High Reward.
Yes, they’re rare.
Yes, they’re like lotto tickets.
But you don’t need to win often if you only risk a little and win big when it counts.
What’s not rare is:
Traders risking big on uncertain setups
Going all in on gut feelings
Wiping out in one or two bad trades
That’s not strategy — that’s self-destruction.
---
🧾 The 2 Core Rules of Risk:
Protect capital at all costs
Only take trades where potential reward outsizes the risk
Don’t flip the logic.
Too many traders hear “high risk = high reward” and assume high risk is required.
It’s not.
That mindset is built for Vegas, not for Wall Street.
---
🧠 If You Want to Be a Trader — Not a Gambler:
You must believe in:
Small risk, big reward
Patience
Discipline
Letting time and luck compound your edge
No other way.
🎯 If you truly get this… congrats.
You’ve crossed the line from gambling to trading.

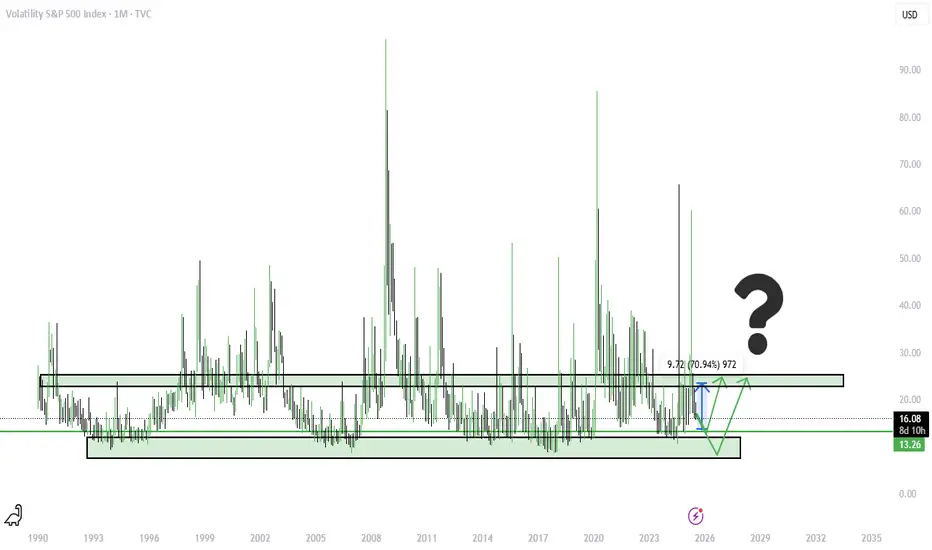
$VIX Volatility Extremes, Narratives, Booms & Busts!TVC:VIX volatility index extremes have always been an important factor when assessing the cyclical nature of financial markets.
I demonstrate in this chart what values and narratives to look out for at these extremes. This can help ignore the noise when buying during low social mood / fearful events when everyone else is panic selling, and, selling during exuberance and booms when everyone else is FOMO buying.
This is the cyclical nature and intertwined relationship between media, events and financial markets that traders and Investors want to take advantage of.
Good times create positive social mood, exasperating over leveraging and booms with extreme positive news / silly price targets 'New Golden Age / Paradigm shift' style reporting.
This unwinds aggressively creating negative social mood which the media exasperate with 'fear and doom' reporting.
VIX is a useful tool to hedge against market uncertainty.
Safe trading

If we close above last week low, this may prove a good entry This channel is not providing individualized trading or investment advice, nor is it a banking service, brokerage service, trading service, investment service or money management service

VIX Breakout: Forex Traders, Buckle Up for Volatility!🚨 VIX Surge: What Currency Traders Need to Know Right Now 🌪️💱
📊 Chart Context & Technicals:
The recent breakout in the VIX signals a major shift in global risk sentiment! 📈 The index has leapt off its base, showing markets are bracing for uncertainty. For forex traders, this is a flashing signal: volatility in equities often spills over into FX, amplifying moves in major pairs and risk-sensitive crosses. ⚡️
🌍 Geopolitical & Macro Backdrop:
This VIX spike is fueled by President Trump’s aggressive new tariffs on BRICS-aligned nations. 🏛️🔥 These moves have reignited global trade war fears, rattled equity markets, and triggered a broad risk-off wave. Historically, VIX surges = sharp swings in USD, JPY, CHF, and commodity-linked currencies. The USD, usually a safe haven, is now under pressure from both trade uncertainty and looming Fed rate cuts as the U.S. economy slows. 🏦📉
💱 FX Market Implications:
USD: The dollar is caught between safe-haven demand and worries over U.S. growth and deficits. Initial VIX spikes can boost USD, but ongoing trade tensions and dovish Fed signals are weighing it down. 💵⚖️
JPY & CHF: Classic safe-haven currencies! As VIX rises, expect flows into JPY and CHF, especially against high-beta currencies like AUD, NZD, and EM FX. 🗾🇨🇭
EUR, GBP, AUD, CAD: European currencies are outperforming in 2025, thanks to fiscal stimulus and capital inflows. Commodity currencies remain volatile, tracking risk appetite and global growth swings. 💶💷🇦🇺🇨🇦
🛠️ Trading & Strategy Takeaways:
Volatility = Opportunity: Elevated VIX means wider ranges and more frequent breakouts in FX. Prime time for breakout and momentum strategies, but demands tighter risk controls and dynamic position sizing! 🚦
Watch Correlations: Rising VIX typically strengthens JPY and CHF, while risk currencies (AUD, NZD, EM FX) weaken. USD direction is more nuanced—initially bid, but vulnerable to U.S. policy missteps and data misses. 🔄
Event Risk: With Trump’s tariff policy in flux and central banks diverging, expect FX volatility to stay high. Stay nimble around news releases and be ready for headline-driven whipsaws! 📰⚡️
🎯 Pro Takeaway:
The VIX is flashing a clear warning for currency traders: risk sentiment is deteriorating, and volatility is back in force. This environment rewards disciplined, adaptive trading—favoring safe-haven currencies, tactical hedges, and a readiness to pivot as policy headlines evolve. For those trading USD/JPY, EUR/USD, and cross-rates, expect bigger intraday swings and more false breakouts. Use the VIX as your real-time risk barometer and adjust your strategies accordingly! 🧭
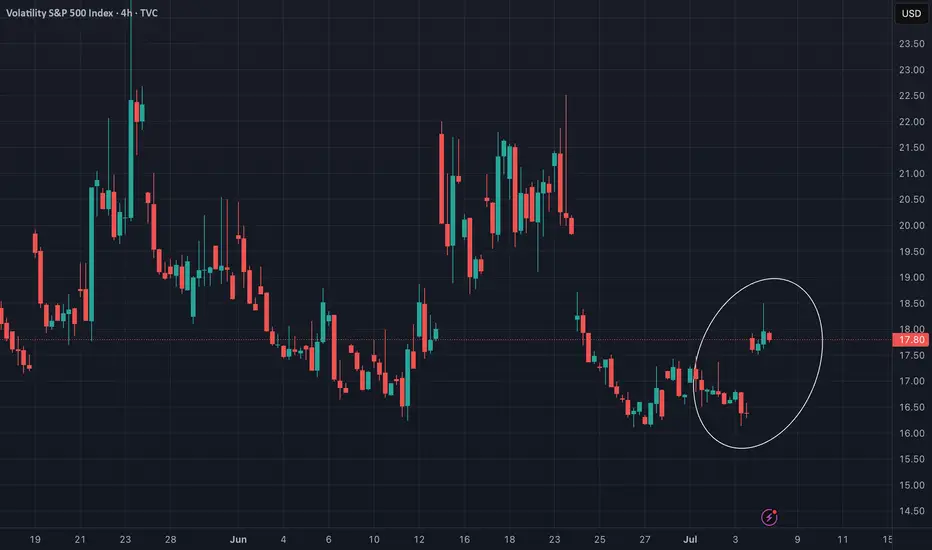
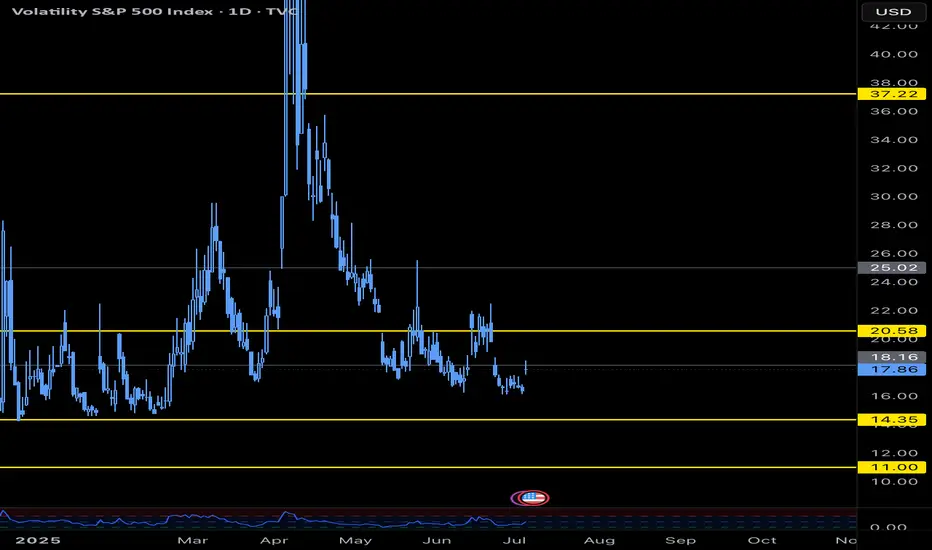
VIX Hits Key Level as S&P 500 Breaks Out – What’s Next?I keep a close eye on VIX levels that consistently matter — and one of those was just tagged:
📍 VIX levels I watch:
11.00 | 14.35 | 18.16 | 20.58 | 37.22
Today, we spiked up to 18.16 and stalled. This is my "in-between" level — not major, but notable — and we’re already seeing volatility slow right at that point.
Meanwhile, the S&P 500 ( SP:SPX ) has broken out to fresh all-time highs.
What I’m watching now:
➜ Will VIX stay below 20.58 and compress further?
➜ Does SPX hold the breakout into early July?
➜Could this set the tone for a melt-up summer?
July’s first half is historically up and a mixed bag in the back half, but the price action and volatility narrative could give us the edge. July is the best month of Q3 traditionally (institutions). Stay focused on the close and the VIX response.
#VIX #SP500 #SPX #volatility #macro #tradingview #DisciplineTrading
Weekly Volatility SnapshotGood Morning -- ☀️☀️☀️
What an amazing last full week of June that was as we pulled out of corrective territory and onto new ATHs with the SP:SPX body of its weekly candle moving +3.41% -- bottom to top. The weekly move open-to-close was +$98.40 as that is how I gauge my volatility metrics. This in comparison is closest in value to IV entering the week as it was stating an implied move of +/-$102.08, which was a volatility read of 16.34% -- As you see in reflection of the weekly chart below and within daily candle structure, price action moved upwards all week surpassing quarterly marks. This in turn is raising short-term volatility and lowering monthly averages as we rotate higher.
Here is the weekly price action of the TVC:VIX from a 5m perspective. This is showing the EOW trend break upwards drilling the indices back down -- A healthy pullback after being seemingly over-extended. This happened during the news cycle release of the U.S. and Canada reciprocal tariff disagreement. Hopefully this settles over the weekend and we rotate higher into the 4th of July week.
Now looking towards this holiday week -- We have the SP:SPX IV (13.29%) after melting during the ATHs move previously -3.09% -- This places IV on the sliding yearly spectrum at the 39% down range showing increasing discount in yearly value. Remember, If you form option positions IV affects VEGA 1% at a time and the algos bid down IV in contracting markets as they rotate higher. HV10 (12.46%) has hinged down and still is contractive per IV prediction but, increasing in comparison with a ' strength of IV ' now showing 94% entering this week.
As the TVC:VIX has closed at $16.32 -- I believe that there is still a little room to extend potentially upwards to the HV10 weekly range of $6253.59. Currently, the SP:SPX YTD return is +4.96% with weekly momentum pointing up and room for volatility to still decrease. If this mark is reached it would put the YTD return at +6.52%. Very feasible and realistic being halfway through the year and going into the 4th of July 🇺🇸🇺🇸🇺🇸🇺🇸 Watch as we climb the wall of worries around us. This would in turn decrease short-term volatility more maybe even to a bottoming point and IV would melt during the rotation upwards with the VIX slowly grinding down.
Come back next week as we review what happened within the implied ranges posted and overlook the volatility potentially bottoming and looking towards a VIX spike in the near future.
Remember to know your ABCs and stay hedged against your bias! CHEERS!

VIX break-outs using GC, DC.VIX break-outs using a simplistic, effective approach, probabilities. Market themes or regimes based on markov chains?
keeping it simple.
Weekly Volatility SnapshotGood Morning --
I hope everyone had a good week of trading ranges -- although short, we saw some VOLATILITY .
Here we will step back with the year-to-date TVC:VIX in the background as we look towards a fresh week trading within the broader market ranges.
Let us begin --
Last week the S&P500 -- with the SP:SPX gapped up opening into strength of a short week at $6,007.46 and wicking up to $6,050.83 only to sell off during U.S. wartime engagement threats within the news cycle, closing the weeks range at $5,984.57. This provided a move of $96.96 and is most comparative to what IV (16.18%) stated entering last week -- that was predicting a range of +/- $101.24.
Now, looking towards this week -- IV (16.34%) is nearly unchanged as HV10 (9.75%) is showing a 'strength of IV' lowering at only 60% currently. IV within the yearly spectrum sits with an IVp of 74% -- fairly expensive as this can show the majority of money is spending up to protect downside uncertainties.
Understandable of course.
Our long-term trending volatility of HV63 (30.25%) is showing a 'strength of IV' at 185% which is correlating to an implied move of +/- $188.98 for the week. This is an advantage if reached of $86.90 over stated IV. A massive premium capture potential.
With the MACRO news cycle pointing EXTREMELY NEGATIVE, I will be watching for volatility expansion. I believe futures will open up gapping into quarterly marks -- this is just my humble opinion of course.
I see the opposite of last week happening, where we gap down and run up into the week. I don't hold a swing position, just an observation that psychologically retail will flip bearish on wartime news with a massive gap down, only to get trapped as broader markets expand upwards into the week.
That's all for now. Everyone have a good week trading ranges, and I will see you Saturday to review! As always, know you ABCs and stay hedged for whatever your bias may be!
CHEERS

VIX....nicely set-upVIX typically is not this low and the beauty of it is that it spikes 5-7 times a month about 5%. If you're in the lookout of a nice opportunity, this is nicely set-up atm. It may take a day or two to jump, but rallies typically have a pullback after a few good days. When profit taking hits, and it will come very soon, the VIX will spike again. You can use UVIX! It's the best ETF proxy IMHO if you understand how to use it.
Always do your own due diligence and best of luck!

JUN 24 - SPY VIX DXY GLD USO SPY (4H)
Trend: Bullish
Current price: 604.32
Active resistance block: 604.33
Channel: Rising, intact
Key support: 581.99
📈 Break above 604.33 could trigger fast move toward 610+
🔹 QQQ (4H)
Price: 536.25
Resistance: 536.45
Support: 509.95
Volume: Building under resistance
📊 Breakout expected if 537 is cleared with volume
🔹 VIX (4H)
Level: 13.89
Trend: Bearish
Support: 11.60
🔻 Falling volatility supports continued upside in equities
🔹 BTC/USD (4H)
Price: 105,244
Volatility: 10.14
Rebounding from: Block at 99,914
Institutional CALL flow at 106,512 (+19.3%)
🟢 If BTC holds above 104k, next target is 111,292 block
🔹 US10Y (4H)
Price: 536.45
Testing: Channel resistance
⚠️ Watching for rejection at 540 or breakout toward 550
→ Impacts tech sector positioning
🔹 GLD (4H)
Price: 306.42
Support zone: 305.9
Institutional PUTs around strike 308
🔻 Bearish pressure remains; loss of 305 opens path to 291

Can Geopolitics Redefine Market Risk?The Cboe Volatility Index (VIX), which analysts widely dub the "fear gauge," currently commands significant attention in global financial markets. Its recent surge reflects profound uncertainty, particularly from escalating geopolitical tensions in the Middle East. While the VIX quantifies market expectations for future volatility, its current elevation signals more than mere sentiment. It represents a sophisticated repricing of systemic risk, capturing the implied probability of significant market dislocations. Investors find it an indispensable tool for navigating turbulent periods.
The dramatic escalation of the Iran-Israel proxy conflict into a confrontation, involving the United States, directly fuels this heightened volatility. Israeli airstrikes on Iranian military and nuclear facilities on June 13, 2025, prompted swift Iranian retaliation. Subsequently, on June 22, the U.S. launched "Operation Midnight Hammer," conducting precision strikes on key Iranian nuclear sites. Iran's Foreign Minister immediately declared diplomacy over, holding the U.S. responsible for "dangerous consequences" and vowing further "punishment operations," including a potential closure of the Strait of Hormuz.
This direct U.S. military intervention, particularly targeting nuclear facilities with specialized munitions, fundamentally alters the conflict's risk profile. It moves beyond proxy warfare into a confrontation with potentially existential implications for Iran. The explicit threat to close the Strait of Hormuz, a critical global chokepoint for oil supplies, creates immense uncertainty for energy markets and the broader global economy. While historical VIX spikes from geopolitical events often prove transient, the current situation's unique characteristics introduce a higher degree of systemic risk and unpredictability. The Cboe VVIX Index, measuring the VIX's expected volatility, has also risen to the higher end of its range, signaling deep market uncertainty about the future trajectory of risk itself.
The current environment necessitates a shift from static portfolio management to a dynamic, adaptive approach. Investors must re-evaluate portfolio construction, considering long exposure to volatility through VIX instruments as a hedging mechanism, and increasing allocations to traditional safe havens like U.S. Treasuries and gold. The elevated VVIX implies that even the predictability of market volatility is compromised, demanding a multi-layered risk management strategy. This specific confluence of events might signify a departure from historical patterns of short-lived geopolitical market impacts, suggesting geopolitical risk could become a more ingrained and persistent factor in asset pricing. Vigilance and agile strategies are paramount for navigating this unpredictable landscape.

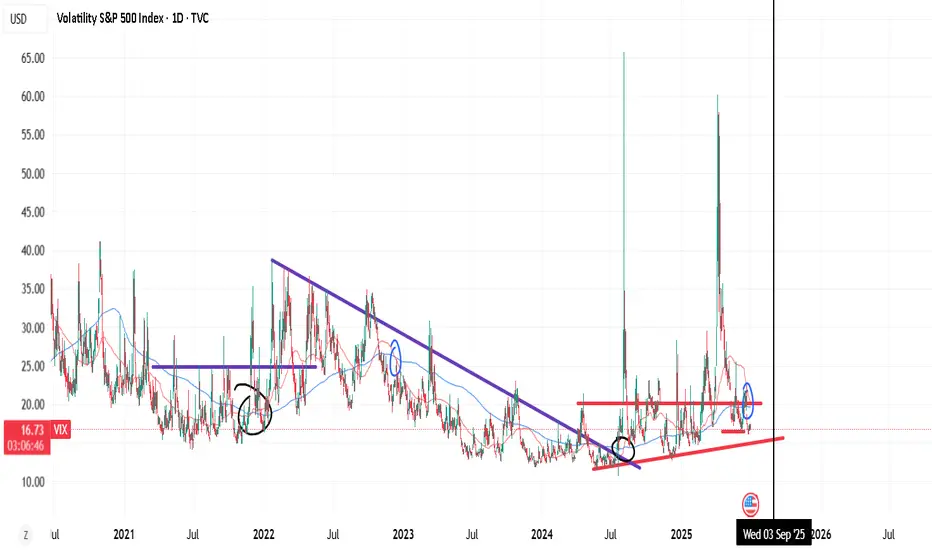
$VIX - Setting in Higher Lows. End of 2025? TVC:VIX - Setting in Higher Lows.
The VIX is the volatility index, measuring high and low volatility environments in US markets.
🟥 Red zone = Volatility Extremes
🟩 Green Zone = Volatility Lows
Do you track the VIX?

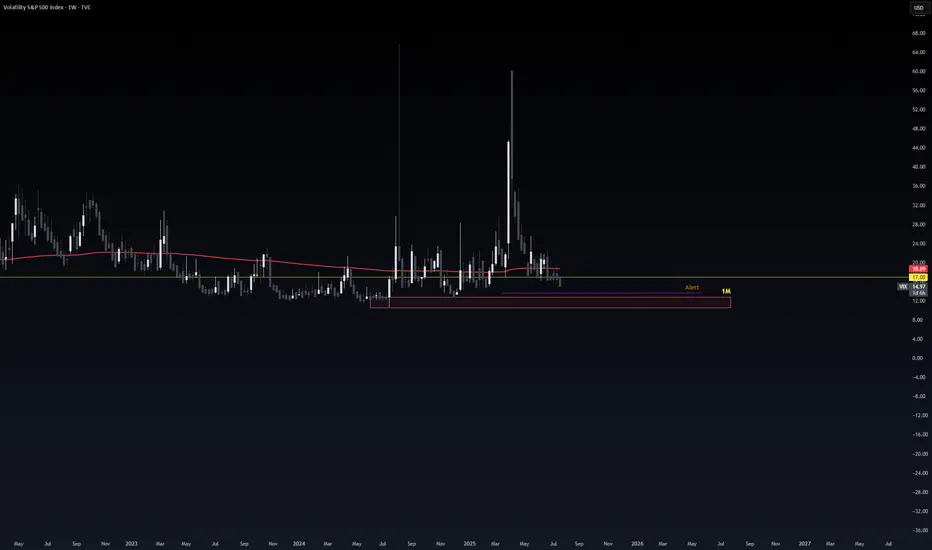
How to use $VIX as a Family Investor?VIX Zones for Family Investors (Fortnightly Review)
1. BTFD Zone (Buy the Fear Dip):
• VIX above 22
• This is a buying opportunity. The higher the VIX, the greater the market fear—take advantage if you have capital available.
2. Cruise Control Zone:
• VIX between 18 and 22
• Do nothing. No buying or selling—just stick to your routine and monitor the market.
3. Profit-Taking Zone:
• VIX below 18
• Consider taking profits from higher-volatility stocks and reallocating to more defensive, large-cap stocks. This helps protect your gains in case of a sudden market drop.

VIX TVC:VIX (4H)
SUP: 18.30 / 16.23
RES: 21.06 / 27.00 / 29.55
Above 21 = short-term panic → targets 23–27
Below 18.30 = volatility crush back to 16–13
Watch the 36–38 GAP if macro risk accelerates.
#VIX #Volatility #Markets

Weekly Volatility Snapshot Good Evening -- Here we are again looking down the barrel of another week tracking the volatility within the broader markets!
Let us begin --
Last week, the TVC:VIX was trending down as the S&P500 rotated upwards making it within 1.43% of highs, before selling off on war conflict news to end the week -- spiking the VIX again. We are now 114 days into the correction with uncertainty still being the only thing that is defined.
However, it does seem that buyers are stepping in during these times of selling off. But, without lifting the uncertainty of trade deals and deadlines or negative news cycles, we could just be locking in a lower high and within another bear market phase.
As we trend into the 2nd half of June, the SP:SPX has an IV (16.18%) entering the week trending 72% to it's yearly range suggesting slightly expensive premium. This is up from 52% IVp last week. Now in comparison to what is happening, HV10 (9.94%) is showing a lower volatility range than stated IV by -6.24%.
This can be important when considering a premium disadvantage with a consolidating VIX under already expensive premium. The 'strength of IV' here is 61% -- and in turn my weighted implied ranges for the week are $5,914.78 - $6,039.16.
If there happens to be a volatility spike this week due to anything out of the blue, we will find our range expanded to long-term trending means of quarterly values, that being HV63 (30.39%). This would create a 'strength of IV' of 188% and a massive spike in the VIX -- respectfully these weighted implied ranges would be $5,786.82 - $6,161.12.
As always, I hope you enjoy the weekly write up and have a great week of trading ranges! Know you ABCs and REMEMBER stay hedged people.
Till next week, CHEERS.
